Fig. 2
Download original image
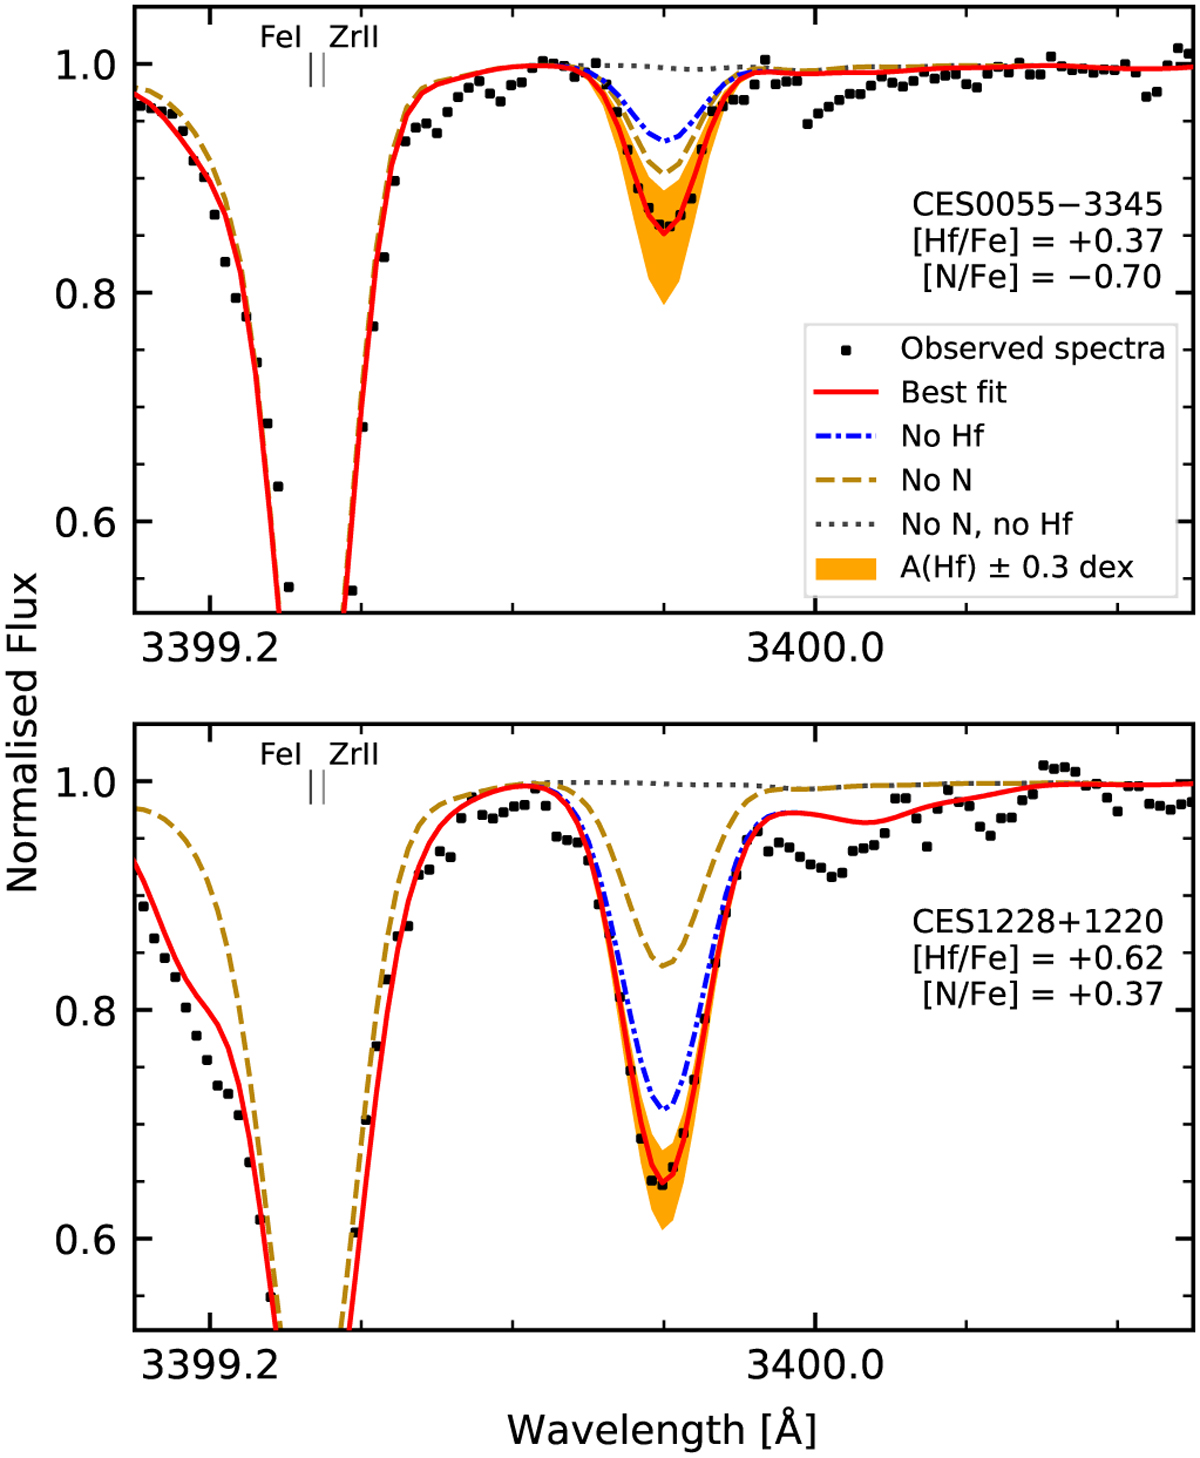
Portion of spectra surrounding the Hf II line at 3399.8 Å for two stars in our sample. Black dots represent the observed spectra. The red solid lines represent the best fit, with their respective [Hf/Fe] shown on the right. Blue dash-dotted lines show synthetic spectra without Hf. Golden dashed lines represent synthetic spectra when N is removed. Grey dotted lines correspond to the synthetic spectra without either N or Hf. Orange shaded areas display a ±0.3 dex interval around the best fit. The N abundances shown are from Paper II.
Current usage metrics show cumulative count of Article Views (full-text article views including HTML views, PDF and ePub downloads, according to the available data) and Abstracts Views on Vision4Press platform.
Data correspond to usage on the plateform after 2015. The current usage metrics is available 48-96 hours after online publication and is updated daily on week days.
Initial download of the metrics may take a while.