Fig. 10
Download original image
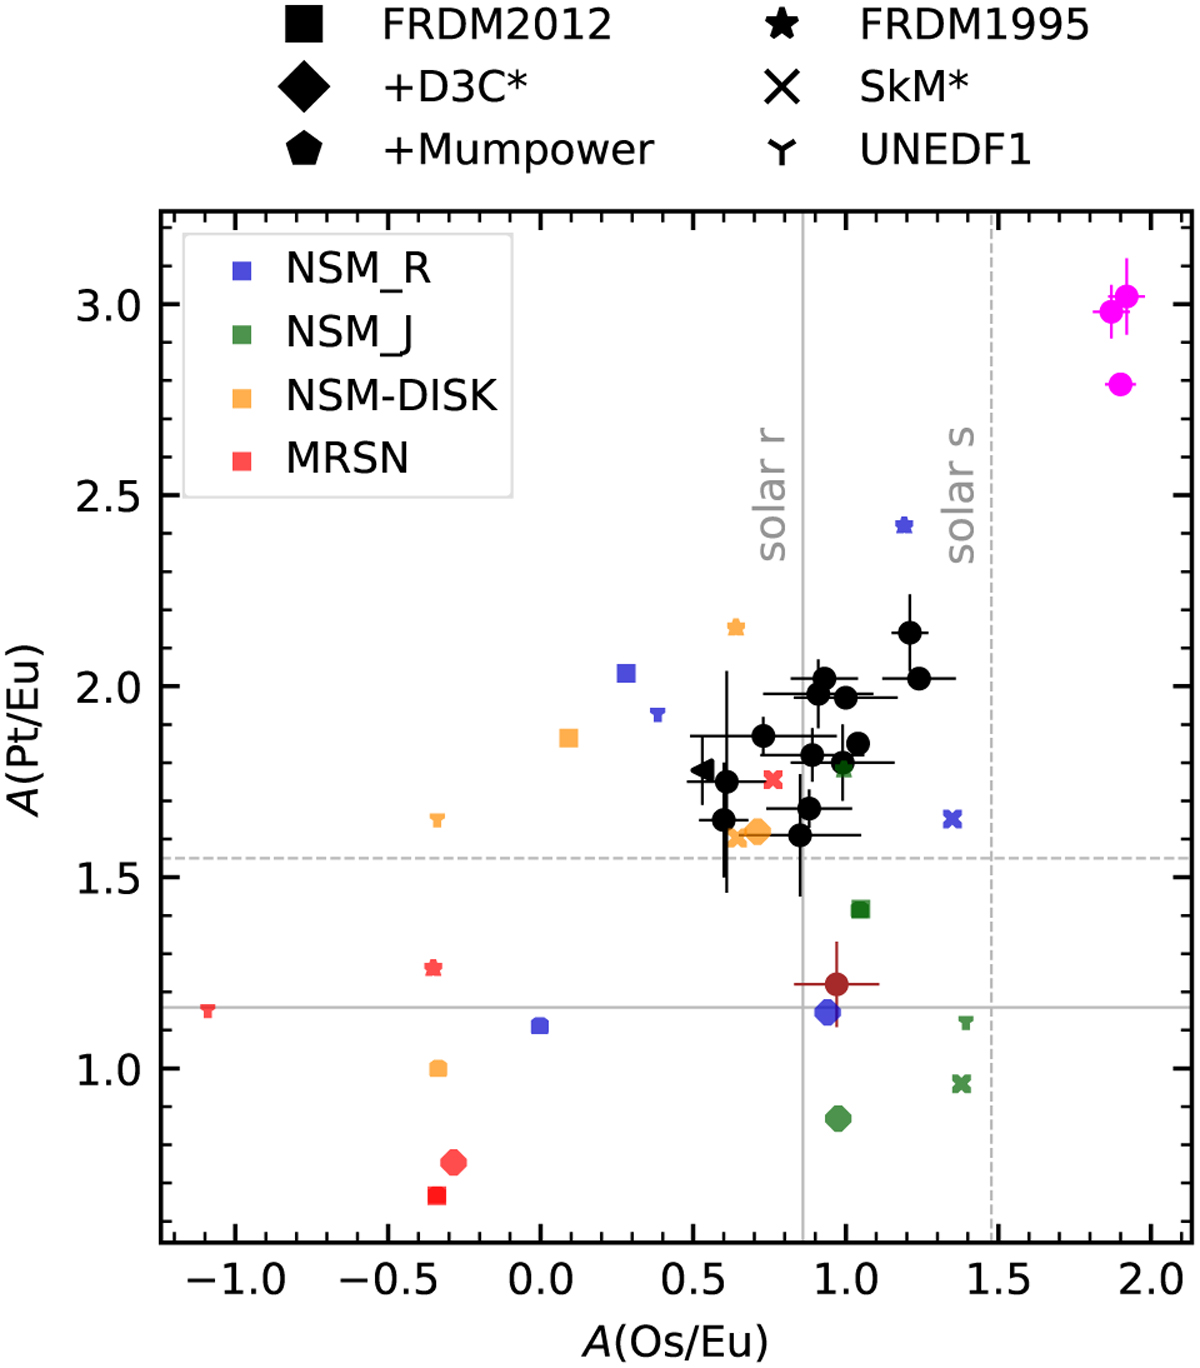
A(Pt/Eu) vs. A(Os/Eu) for observations and nucleosynthesis calculations. Black circles with error bars are abundance detections derived in this work, while left-pointing triangles are upper limits in Os. Sneden’s star is depicted in brown, while the solar r- (s-) residuals are given by the grey solid (dashed) lines. The calculations assume different r-process sites (colours) and different nuclear inputs (symbols). None of the calculations are able to reproduce the large A(Pt/Eu) and A(Os/Eu) values of the three stars in the upper right (magenta), which make up the Eu-tail in Fig. 8.
Current usage metrics show cumulative count of Article Views (full-text article views including HTML views, PDF and ePub downloads, according to the available data) and Abstracts Views on Vision4Press platform.
Data correspond to usage on the plateform after 2015. The current usage metrics is available 48-96 hours after online publication and is updated daily on week days.
Initial download of the metrics may take a while.