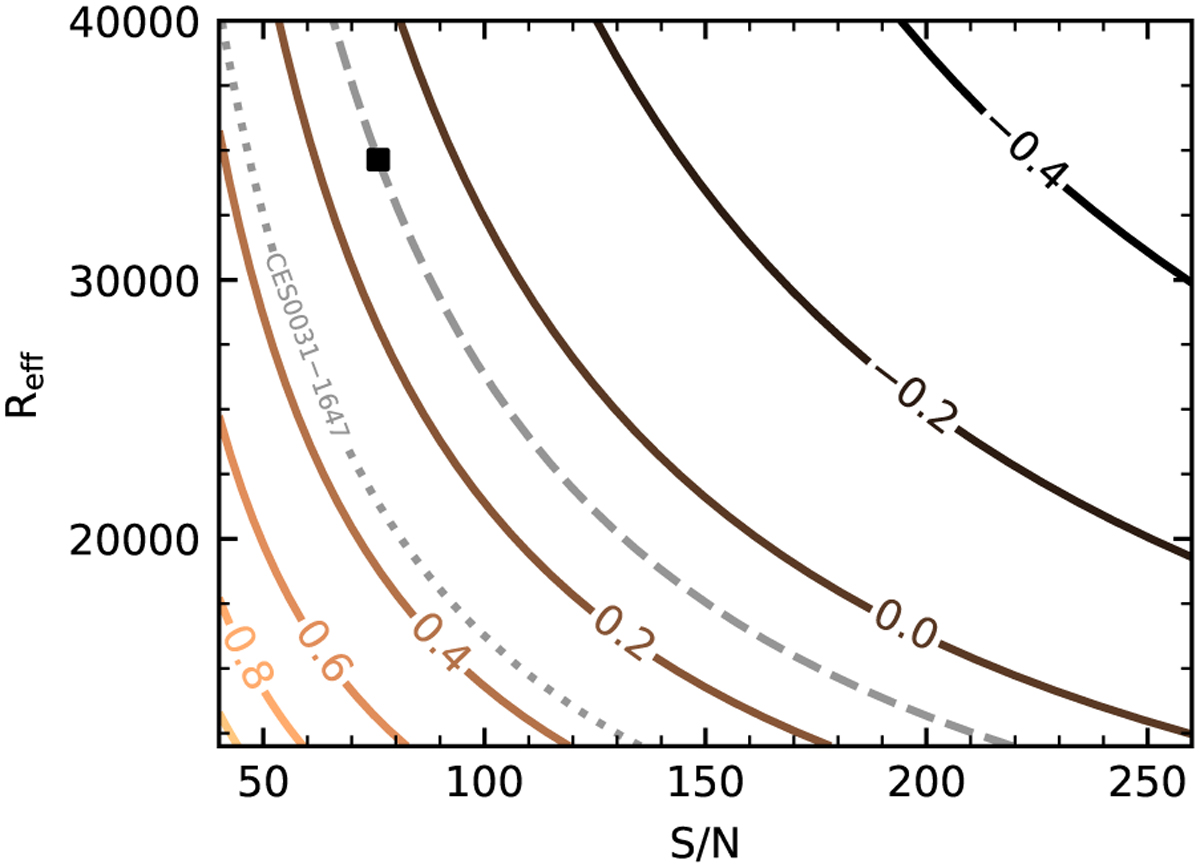
Fig. 1
Download original image
Illustration of the method employed for classification of detections and upper limits. The solid lines are curves of constant [Hf/Fe]min calculated for CES 0031-1647 using Eq. (6) and a CoG model generated with MOOG for the Hf II 3399.8 Å line to convert RWmin to Hf abundances. Their colour scale corresponds to the [Hf/Fe]min labelled in each solid line. The dotted grey line corresponds to the [Hf/Fe] measured in this work, assuming a solar Hf abundance of 0.85 dex (Asplund et al. 2009). The black square marks the point of the estimated S/N and the Reff of CES 0031-1647, indicating that the minimum detectable abundance [Hf/Fe]min for that star with our CERES spectrum is 0.10 dex. The unlabelled dashed line crossing that point represents [Hf/Fe]min = 0.10 for different combinations of S/N and Reff. Abundances to the left of the dashed line will be detections, while abundances to the right side of the dashed line will result in upper limits.
Current usage metrics show cumulative count of Article Views (full-text article views including HTML views, PDF and ePub downloads, according to the available data) and Abstracts Views on Vision4Press platform.
Data correspond to usage on the plateform after 2015. The current usage metrics is available 48-96 hours after online publication and is updated daily on week days.
Initial download of the metrics may take a while.