Fig. 3
Download original image
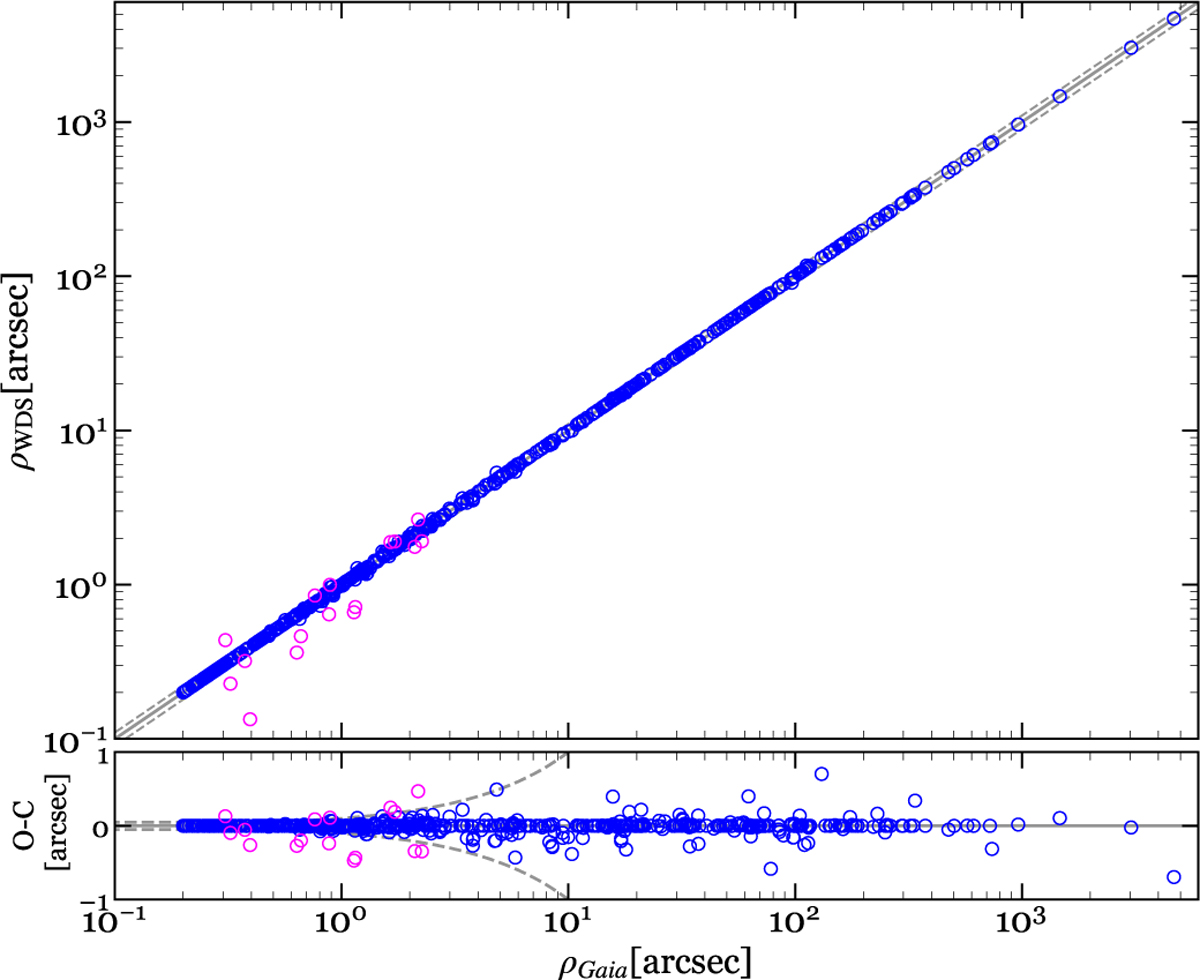
Comparison of projected separations tabulated by the WDS and measured by us using Gaia astrometry. The solid and dashed grey lines represent the 1:1 relation, and the differences in 10%, respectively. The magenta circles are stars beyond this limit. The error bars are rather small for almost all cases due to the high precision of Gaia’s astrometry and they have therefore been omitted.
Current usage metrics show cumulative count of Article Views (full-text article views including HTML views, PDF and ePub downloads, according to the available data) and Abstracts Views on Vision4Press platform.
Data correspond to usage on the plateform after 2015. The current usage metrics is available 48-96 hours after online publication and is updated daily on week days.
Initial download of the metrics may take a while.