Fig. 15
Download original image
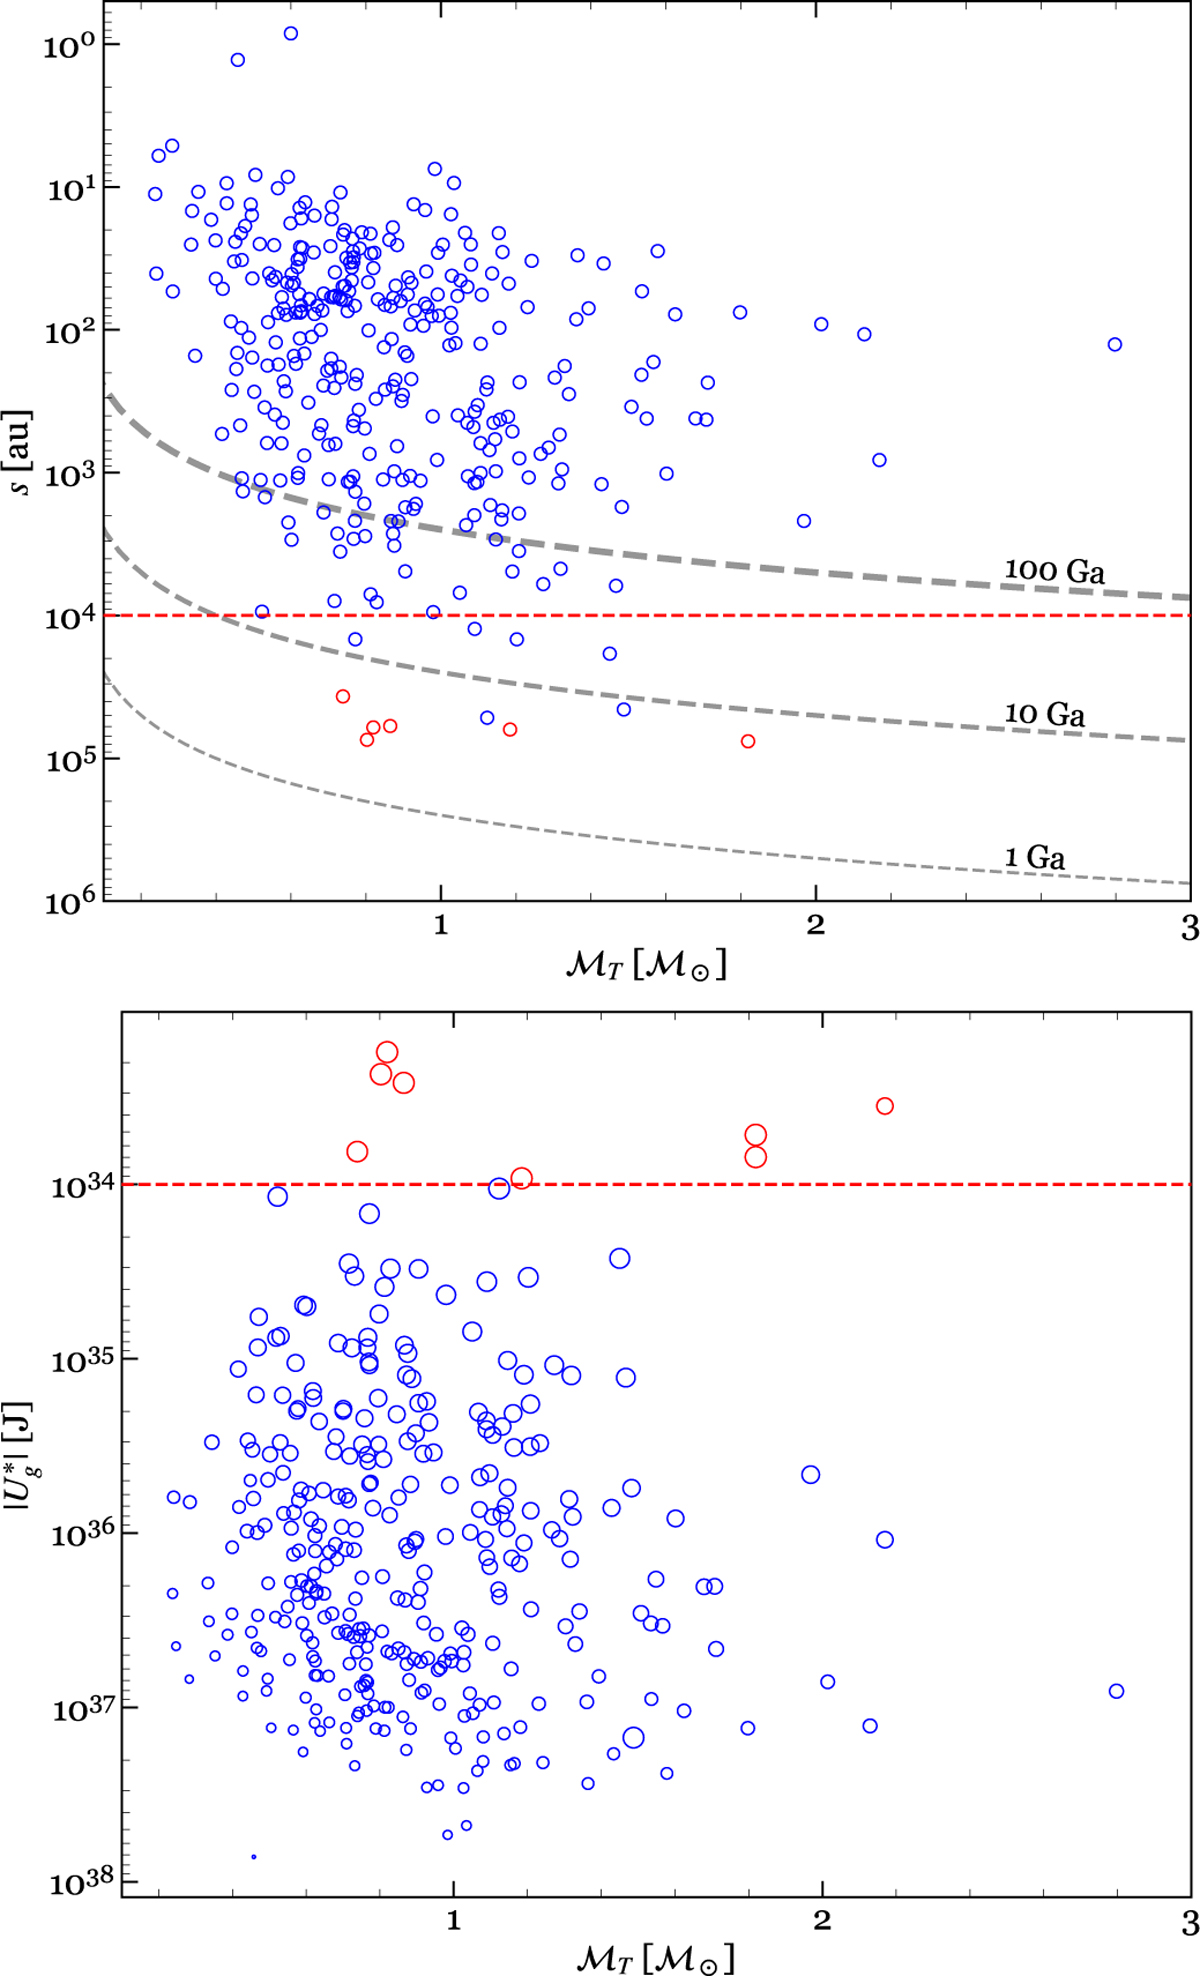
Physical separation (top) and binding energy (bottom) as a function of system total mass. In the bottom panel, sizes are proportional to the physical separation from the primary. Red open circles highlight in both panels the most fragile pairs (![]() in the upper panel two of the datapoints overlap, as they share a common ℳT and roughly equal separation.) The grey dashed lines mark the maximum separation, s, for expected survival in the case of 100, 10, and 1 Ga (from top to bottom). The red horizontal dashed lines mark the representative limits of 104 au (top) and 1034 J (bottom).
in the upper panel two of the datapoints overlap, as they share a common ℳT and roughly equal separation.) The grey dashed lines mark the maximum separation, s, for expected survival in the case of 100, 10, and 1 Ga (from top to bottom). The red horizontal dashed lines mark the representative limits of 104 au (top) and 1034 J (bottom).
Current usage metrics show cumulative count of Article Views (full-text article views including HTML views, PDF and ePub downloads, according to the available data) and Abstracts Views on Vision4Press platform.
Data correspond to usage on the plateform after 2015. The current usage metrics is available 48-96 hours after online publication and is updated daily on week days.
Initial download of the metrics may take a while.