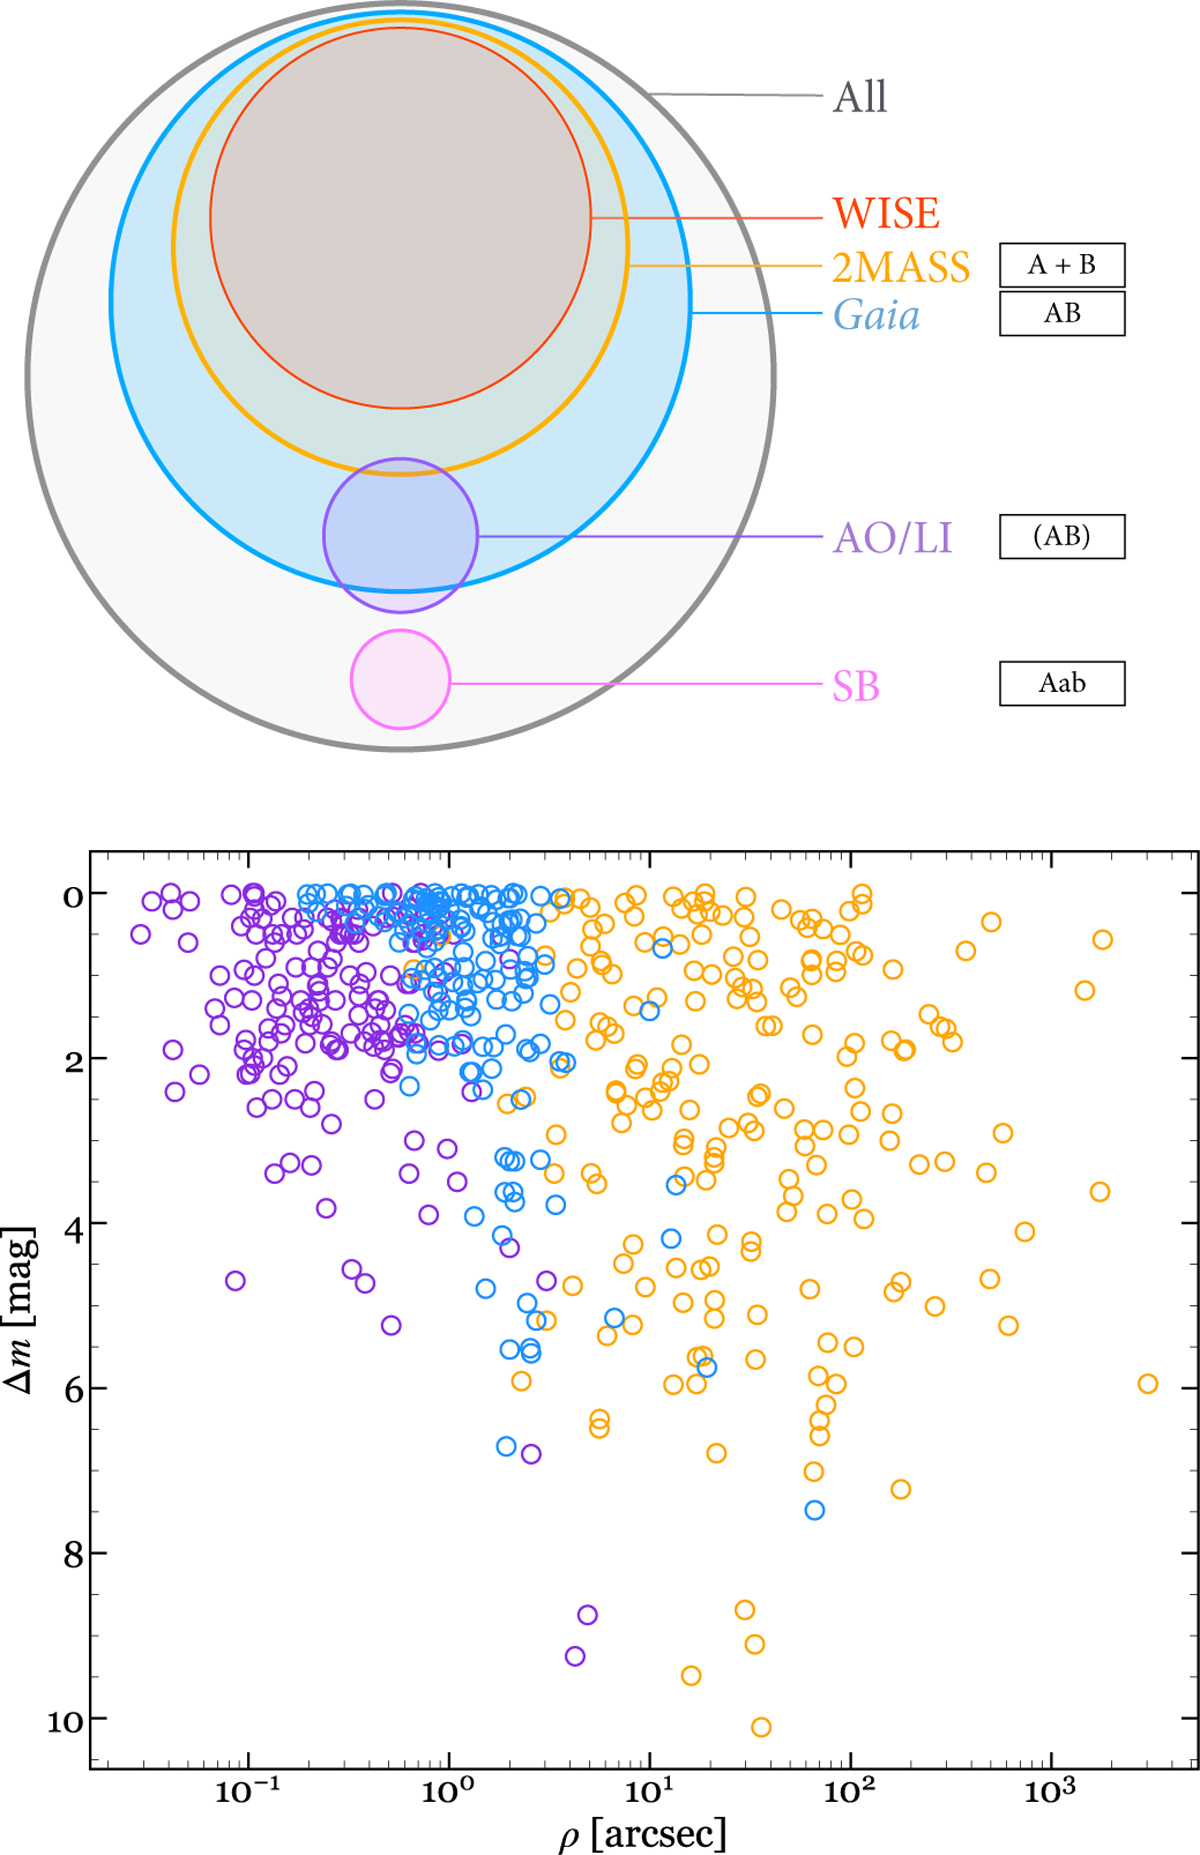
Fig. 12
Download original image
Schematic of the capabilities to identify binaries of the surveys and techniques exploited in this work (top) and difference in G magnitude as a function of angular separation for pairs that Gaia resolves (“AB” or “A+B”) and those for which WDS tabulated magnitude difference (bottom). Both figures follow the same scheme of colours. The nomenclature assigned to each scenario (see again Fig. 10) is also displayed.
Current usage metrics show cumulative count of Article Views (full-text article views including HTML views, PDF and ePub downloads, according to the available data) and Abstracts Views on Vision4Press platform.
Data correspond to usage on the plateform after 2015. The current usage metrics is available 48-96 hours after online publication and is updated daily on week days.
Initial download of the metrics may take a while.