Fig. 1
Download original image
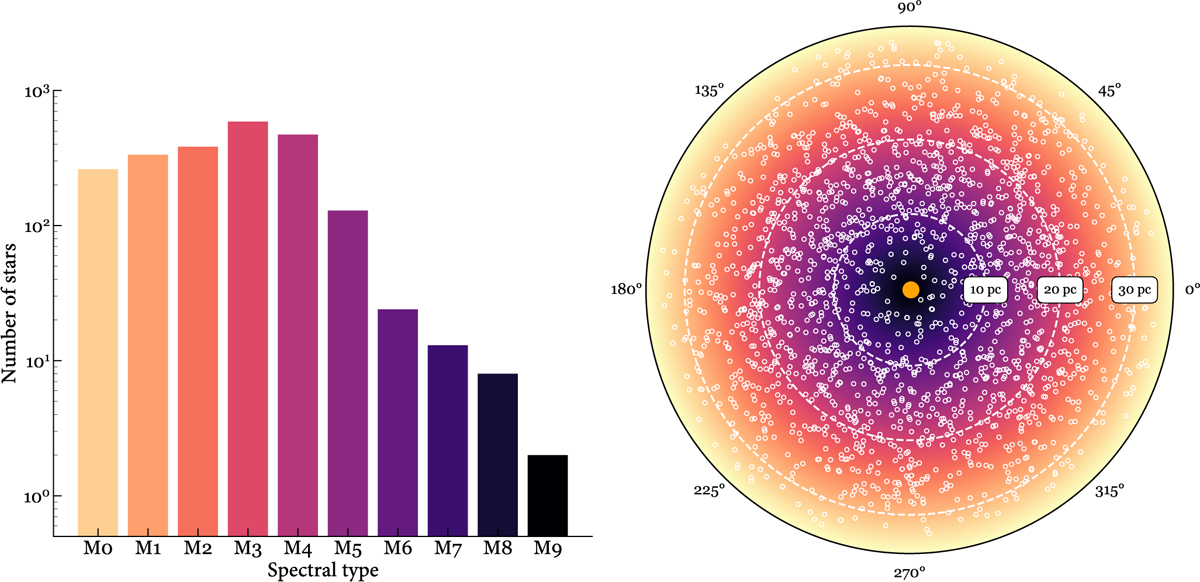
Distribution of spectral types of the stars in the sample (left) and illustration of the completeness distance of Carmencita (right). The latter panel shows the distance and right ascension α of the Carmencita stars in the solar neighbourhood and colour-codes the spectral subtype as a function of the distance to which our sample is complete. The dashed lines depict 10-parsec increments of the distances.
Current usage metrics show cumulative count of Article Views (full-text article views including HTML views, PDF and ePub downloads, according to the available data) and Abstracts Views on Vision4Press platform.
Data correspond to usage on the plateform after 2015. The current usage metrics is available 48-96 hours after online publication and is updated daily on week days.
Initial download of the metrics may take a while.