| Issue |
A&A
Volume 693, January 2025
|
|
|---|---|---|
| Article Number | L17 | |
| Number of page(s) | 5 | |
| Section | Letters to the Editor | |
| DOI | https://doi.org/10.1051/0004-6361/202452518 | |
| Published online | 24 January 2025 | |
Letter to the Editor
A nuclear spiral in a dusty star-forming galaxy at z = 2.78
1
European Southern Observatory, Karl-Schwarzschild Str. 2, D-85748 Garching bei München, Germany
2
Max Planck Institute for Astrophysics, Karl-Schwarzschild Str. 1, D-85748 Garching bei München, Germany
3
Kapteyn Astronomical Institute, University of Groningen, PO Box 800 9700 AV Groningen, The Netherlands
4
South African Radio Astronomy Observatory (SARAO), PO Box 443 Krugersdorp, 1740
South Africa
5
Department of Physics, University of Pretoria, Lynnwood Road, Hatfield, Pretoria, 0083
South Africa
⋆ Corresponding author; This email address is being protected from spambots. You need JavaScript enabled to view it.
Received:
7
October
2024
Accepted:
4
December
2024
Abstract
The nuclear structure of dusty star-forming galaxies is largely unexplored but harbours critical information about their structural evolution. Here, we present long-baseline Atacama Large (sub-)Millimetre Array (ALMA) continuum observations of a gravitationally lensed dusty star-forming galaxy at z = 2.78. We use a pixellated lens modelling analysis to reconstruct the rest-frame 230 μm dust emission with a mean resolution of ≈55 pc and demonstrate that the inferred source properties are robust to changes in lens modelling methodology. The central 1 kpc is characterised by an exponential profile, a dual spiral arm morphology and an apparent super-Eddington compact central starburst. We find tentative evidence for a nuclear bar in the central 300 pc. These features may indicate that secular dynamical processes play a role in accumulating a high concentration of cold gas that fuels the rapid formation of a compact stellar spheroid and black hole accretion. We propose that the high spatial resolution provided by long-baseline ALMA observations and strong gravitational lensing will give key insights into the formation mechanisms of massive galaxies.
Key words: gravitational lensing: strong / galaxies: evolution / galaxies: formation / galaxies: high-redshift / galaxies: structure / submillimeter: galaxies
© The Authors 2025
 Open Access article, published by EDP Sciences, under the terms of the Creative Commons Attribution License (https://creativecommons.org/licenses/by/4.0), which permits unrestricted use, distribution, and reproduction in any medium, provided the original work is properly cited.
This article is published in open access under the Subscribe to Open model. This email address is being protected from spambots. You need JavaScript enabled to view it. to support open access publication.
1. Introduction
At the peak of cosmic star formation (‘cosmic noon’), dust-obscured star-forming galaxies (DSFGs) make up the high end of the stellar mass function (M⋆ ≳ 1010 M⊙) with star formation rates that can exceed 1000 M⊙ yr−1 (Casey et al. 2014; Hodge & da Cunha 2020). Rapid gas accumulation and feedback from star formation and active galactic nuclei (AGNs) are predicted to play important roles in the evolution of DSFGs into quiescent compact spheroids (Hopkins et al. 2009). Yet many open questions remain about the structural evolution of such galaxies through cosmic time (Conselice 2014).
To form an in situ stellar spheroid, gas must lose angular momentum such that it flows into the central kiloparsec faster than it can turn into stars (Dekel & Burkert 2014). It has long been predicted that gas-rich mergers play a critical role in both gas delivery and loss of angular momentum by inducing turbulence, either via major mergers (Sanders & Mirabel 1996; Mihos & Hernquist 1996; Hopkins et al. 2009) or via the fragmentation of gas discs due to gravitational instabilities induced by minor mergers and accretion (Krumholz et al. 2018; Kretschmer et al. 2022). However, recent work has revealed an abundance of rotationally supported (dynamically cold) discs in DSFGs at z = 2 → 5 with rotation-to-random motions comparable to those of local discs (e.g. Lelli et al. 2021, 2023; Rizzo et al. 2021, 2023; Fraternali et al. 2021; Tsukui & Iguchi 2021; Liu et al. 2024). These galaxies have levels of turbulence that can be fully explained by stellar feedback alone, contrary to canonical model predictions (Rizzo et al. 2024). Additionally, suggestions of spiral arms and bars in other z = 2 → 4 DSFGs on kiloparsec-scales (Hodge et al. 2019; Costantin et al. 2023; Amvrosiadis et al. 2024; Tsukui et al. 2024) may point to lower-than-expected turbulence in the population at large (Sheth et al. 2012; Reddish et al. 2022).
On the other hand, spiral arms and bars are believed to facilitate the inflow of gas (Shlosman et al. 1989; Englmaier & Shlosman 2000, 2004) which is consistent with observations of disc galaxies in the local Universe (Davies et al. 2009; Yu et al. 2022a, 2022b). These secular dynamical processes must be operating in the inner sub-kiloparsec to transport gas within the central ∼100 pc, thereby fueling nuclear starburst and supermassive black hole growth (Jogee 2006; Anglés-Alcázar et al. 2021). Therefore, we expect secular processes to operate in DSFGs, at least on small scales. While galaxies in the local Universe occasionally show evidence of nuclear spirals (e.g. Combes et al. 2013; Audibert et al. 2019), it remains unknown whether DSFGs exhibit these features within their central kpc. High-resolution imaging (≲100 pc) could answer this question and, thus, provide key insights into the structural evolution of DSFGs. At cosmic noon, these scales are accessible only with the aid of gravitational lensing magnification.
We investigated dust emission from a z = 2.78 DSFG, lensed by a z = 0.414 foreground elliptical galaxy (Bothwell et al. 2013). Following gravitational lens modelling of long-baseline Atacama Large (sub-)Millimetre Array (ALMA) observations reported by Stacey et al. (2024), we analysed the reconstructed source and find a nuclear spiral morphology. In Section 2 we report the source reconstruction methods. In Section 3, we report the results of our analysis, and we discuss their implications and the direction of future work in Section 4. Finally, we summarise our work in Section 5. Throughout, we assume flat Λ cold dark matter cosmology (Planck Collaboration VI 2020).
2. Data and lens modelling
ALMA observations of SPT 0538−50 (SPT-S J053816-5030.8) in band 7 were obtained from the archive associated with project code 2016.1.01374.S (PI: Hezaveh). The continuum-only observations at 350 GHz correspond to the rest-frame 230 μm in thermal dust emission. The data calibration and reduction were conducted as detailed by Stacey et al. (2024).
The lens modelling was performed by Stacey et al. (2024) using pronto, a semi-linear inversion methodology adapted for interferometric data, solving simultaneously for the lens model parameters and the source surface brightness (Powell et al. 2021, 2022, but see also Vegetti & Koopmans 2009; Rybak et al. 2015; Rizzo et al. 2018; Ritondale et al. 2019; Ndiritu et al. 2024). The lens model comprises an ellipsoidal power law, external shear and multipole expansions up to the fourth order. The source is constructed on a Delaunay grid adapted to the lens model magnification and a regularisation hyper-parameter enforces a correlation between neighbouring points of the source. A ‘clean’ image of the data is shown in Fig. 1 was made by convolving the maximum a posteriori sky model with the Gaussian fit to the dirty beam (the synthesised beam) and adding it to an image of the residual visibilities (data minus model)1.
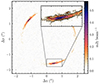 |
Fig. 1. Image of SPT 0538−50 at 350 GHz. The inset shows a zoomed-in view of the southern image with signal-to-noise ratio contours in steps of 3, |

In the lens modelling procedure, assumptions must be made about the mass distribution in the lens and the smoothness of the source in the form of Bayesian statistical priors. Stacey et al. (2024) minimised these assumptions by allowing for additional freedom in the projected mass distribution of the lens. However, here, we also considered different types of regularisation when fitting the source surface brightness. As recently discussed by Galan et al. (2024), different types of regularisation may be appropriate for different sources, lead to stronger or weaker regularisation of the source surface brightness elements and introduce different biases on lens model parameters. We considered three types of source regularisation: gradient, curvature, and area-weighted gradient. Gradient and curvature regularisation types minimise the gradient and curvature of the source surface brightness, respectively, while the area-weighted gradient is a modification of the former whereby the regularisation is weighted by the area of each triangle rather than each triangle being weighted equally. In an extension of the analysis by Stacey et al. (2024), we inferred maximum a posteriori lens models and their associated sources for the three regularisation types, casting every pixel into the source plane. Gradient and curvature regularisation types produce model parameters consistent within 2σ of those reported in Stacey et al. (2024). The area-weighted gradient regularisation model is consistent except for the shear and ellipticity position angles which differ by 2 and 10 degrees, respectively. These discrepancies have a minimal effect on the source as the shear is small (≈1 percent of the convergence) and the lens is very round (axis ratio of ≈0.9).
The posterior parameter distributions of the lens parameters inferred by Stacey et al. (2024) are narrow such that the source surface brightness uncertainty is dominated by noise and artefacts in the data caused by phase and amplitude errors (see also Rizzo et al. 2021; Stacey et al. 2021). We generated uncertainty maps for all three models neglecting the uncertainties in lens model parameters. We inferred an uncertainty in the source plane by generating 1000 mock visibility datasets from the maximum a posteriori lens model and realisations of the noise and performing linear inversions. We then created mean, standard deviation and signal-to-noise ratio maps for each pixel of the reconstructed source. Additionally, we created source-plane magnification maps by mapping the triangulated image pixels into the source plane and calculating the ratio of the triangle areas.
3. Results
As the magnification varies over the source, the effective angular resolution in the source plane is not uniform. We considered two methods for describing the source resolution. Assuming the beam is uniformly magnified, we infer a surface-brightness-weighted mean full width at half maximum (FWHM) of 55 pc (consistent for all three regularisation types). This is very similar to the median distance between the Delaunay vertices when every pixel is cast back into the source plane, ≈50 pc. Therefore, we consider 55 pc a reasonable characterisation of the effective spatial resolution which varies from < 50 to 80 pc over the source.
The reconstructed sources are shown in Fig. 2 (first panels); the source morphologies are very similar. The total lensed flux density we compute from the product of the flux density of the reconstructed source and the magnification map is 0.111 ± 0.011 Jy (0.111 ± 0.011 Jy; 0.114 ± 0.011 Jy) for gradient (curvature; area-weighted) regularisation methods, including a nominal ±10% flux scale accuracy for ALMA calibration. These values are consistent with the measurement of 0.125 ± 0.005 Jy with ±15% flux scale accuracy quoted by Reuter et al. (2020) from an unresolved flux density measurement with APEX/LABOCA at the same frequency. This suggests that there is no significant contribution (< 10%) from undetected, extended low-surface-brightness dust emission.
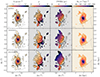 |
Fig. 2. Reconstructed dust continuum of SPT 0538−50. Top to bottom rows: Gradient, curvature, and area-weighted gradient regularisation types, all with the same colour scales. First column: Surface brightness (the area below 3σ significance has been masked, where σ accounts for the noise, artefacts in the data, and the non-linear effects of lensing); contours are in steps of 0.02 Jy arcsec2, and the dashed grey lines show the tangential caustics. Second column: Magnification with signal-to-noise ratio contours in steps of 3σ. Third column: Effective magnification-corrected beam FWHM in the source plane with signal-to-noise ratio contours. Fourth column: Star formation rate surface density and caustics in grey. Ellipses in the bottom-left corner show three magnification-corrected beams in the source plane for |


Fig. 2 (second panels) shows the source-plane magnification for the three reconstructions. Significant variation exists over the source; consequently, the effective beam size varies significantly (Fig. 2; third panels). The magnification is very high at and inside the tangential caustics, so the source appears more granular in this region. Additionally, the low-surface-brightness emission is more apparent where the magnification is lower, with curvature and area-weighted gradient regularisation types more effectively recovering this emission.
An obscured star formation rate of 700 ± 200 M⊙ yr−1 was computed by Reuter et al. (2020) for SPT 0538−50 by fitting the far-infrared–millimere broadband spectral energy distribution (SED; a modified blackbody and Kroupa (2001) initial mass function) and with a quoted magnification of 20 ± 3 based on lens modelling with observations at lower angular resolution. We find a surface-brightness-weighted mean magnification of  (
( ;
;  ) for gradient (curvature; area-weighted) source regularisation types. With these magnification corrections, we infer an obscured star formation rate of 850 ± 270 M⊙ yr−1 (850 ± 270 M⊙ yr−1 and 890 ± 290 M⊙ yr−1) for gradient (curvature; area-weighted); which is consistent with Reuter et al. (2020) within the uncertainties. We note that the uncertainties in the star formation rate from SED fitting dominate the overall uncertainties. The star formation rate density for each source reconstruction, assuming that the dust temperature and emissivity are uniform over the source, is shown in Fig. 2 (fourth panels). The central region of the source has an implied extreme star formation rate of ≈2000 M⊙ yr−1 kpc−2, which is super-Eddington compared to the Eddington limit of nearby ultra-luminous infrared galaxies (Barcos-Muñoz et al. 2017).
We fitted a 2D Sérsic profile to the source using a Markov Chain Monte Carlo sampler (EMCEE; Foreman-Mackey et al. 2013), inferring an effective radius of 0.6 ± 0.1 kpc, a Sérsic index of 1.2 ± 0.2 (where an index of 1 is an exponential disc) and position angle of 4 ± 3 deg (east of north). These parameters are consistent with a compact disc and are comparable with those of other lensed DSFGs (e.g. Stacey et al. 2021; Rizzo et al. 2021), but the source structure is not smooth and the Sérsic provides a poor fit (Fig. 3); the reconstructions for all regularisation types show a dual spiral arm morphology and several clumps with sizes of ≲100 pc at 3–9σ significance. The central region of the source is also not smooth or point-like but resolved into two clumps. These features can also be noted in the lensed images (Fig 1).
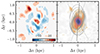 |
Fig. 3. Sérsic and isophote fits of SPT 0538−50 (curvature regularisation). Left: Noise-normalised residuals of the Sérsic fit in solid contours with steps of 3. Right: Reconstructed source with isophotes overplotted. The grey dashed lines show the position angle of the isophotes at 0.25 and 0.5 arcsec semi-major axis radii; the black line shows the position angle of the Sérsic. |
To further characterise the source morphology, we fitted isophotes using the ISOPHOTE tool in the Python package PHOTUTILS (Bradley et al. 2023), a technique commonly employed to characterise the structure of barred spirals in the local Universe (e.g. Gadotti et al. 2007). All isophote parameters were free to optimise (centroid, ellipticity, position angle, third- and fourth-order harmonics). The isophote fit for the source using curvature regularisation is shown in Fig. 3. The ellipticity and position angle of the fitted isophotes for all three regularisation types are shown in Fig. 4. The ellipticity position angle swings from ≈25 deg at 0.2 kpc to −20 deg at 0.6 kpc, with accompanying peaks in ellipticity (labelled in Fig. 4), which is a typical signature of a bar (e.g. Tsukui et al. 2024; Le Conte et al. 2024).
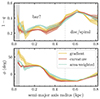 |
Fig. 4. Ellipticity (top; where q is the axis ratio) and position angle (bottom; defined east of north) of isophotes fitted to the reconstructed source of SPT 0538−50. The shaded coloured regions are the standard deviations of the fits and the grey area shows the median beam FWHM in the source plane. The dashed grey line shows the effective radius of the Sérsic fit. The swing in position angle by 45 deg may be due to a nuclear bar. |
4. Discussion
Nuclear bars and spirals have occasionally been found in active and inactive galaxies in the nearby Universe (Buta & Crocker 1993; Martini et al. 2003; Erwin et al. 2015) and are predicted by both idealised and hydrodynamical simulations (Shlosman et al. 1989; Englmaier & Shlosman 2004; Anglés-Alcázar et al. 2021). They are found in discs, are produced by an inflow of cold gas, contain young stellar populations, are rotationally supported, and are thought to probe secular dynamical processes involved in the growth of stellar spheroids and AGN fuelling (Knapen et al. 1995; García-Burillo et al. 2005; Combes et al. 2013; Prieto et al. 2019; Audibert et al. 2019; Gadotti et al. 2020). The effective spatial resolution we have obtained here suggests the presence of spiral arms and a bar on much smaller scales than previously found in DSFGs, yet comparable to the size of observed and simulated nuclear discs (e.g. Combes et al. 2013; Audibert et al. 2019; Anglés-Alcázar et al. 2021) in galaxies with similar stellar masses. The disc is 5 → 10 times smaller than the typical ∼5 kpc effective radius of the stellar discs of DSFGs (Hodge et al. 2024; Gillman et al. 2024). Furthermore, the characteristic exponential profile, spiral arms and possible bar suggest that SPT 0538−50 is dynamically cold, like local nuclear discs (Gadotti et al. 2020).
A high gas density is required to explain the apparently super-Eddington star formation rate density in the central < 200 pc of SPT 0538−50. SPT 0538−50 is known to be rich in molecular gas (∼1010.2 M⊙; Bothwell et al. 2013). The final stages of a gas-rich major merger could result in gas build-up in the central kiloparsec (Jogee 2006), or potentially an inward migration of gas clumps (Dekel & Burkert 2014). However, it seems to be difficult to produce a sufficient loss of angular momentum to pile a high density of gas within ∼100 pc without the additional influence of secular dynamical processes (Jogee 2006; Anglés-Alcázar et al. 2021). The nuclear spiral arms and bar we see here could facilitate this gas inflow.
Spiral arms can be transient or long-lived: transient two-arm spirals reaching into the centre of the galaxy may be induced by tidal interactions (e.g. Dobbs et al. 2010), or they could be long-lived and produced secularly, such as via swing amplification (Toomre 1981). Greater clarity would be achieved with observations at matched angular resolution of stars and emission line kinematics. The resolved gas velocity dispersion, in combination with the resolved stellar distribution, star formation, and gas density, could be used to test models of turbulence associated with secular dynamics or gravitational instabilities induced by mergers and/or interactions (Rizzo et al. 2024). Resolved kinematics on these scales may also reveal evidence of non-circular motions along the spiral arms or bar and allow us to test whether this region is kinematically distinct from the main galaxy disc (e.g. Davies et al. 2009; Lelli et al. 2022; Roman-Oliveira et al. 2023; Tsukui et al. 2024). Additionally, it could be that the spiral morphology of SPT 0538−50 represents only the centre of spiral arms that extend out to several kiloparsecs in unobscured stellar emission, as frequently seen for high-redshift galaxies with JWST (Kuhn et al. 2024; Hodge et al. 2024; Gillman et al. 2024). Furthermore, nuclear discs in the local Universe are usually found within bars (Gadotti et al. 2020); follow-up observations in the rest-frame optical/infrared will determine this for SPT 0538−50.
Another consideration with SPT 0538−50 is whether the compact central dust emission could be attributed to heating by an AGN. Simulations find that a strong AGN radiation field could lead to a higher effective dust temperature and a higher integrated star formation rate inferred from broadband SED fitting (Di Mascia et al. 2023). When computing the reconstructed star formation rate density (Fig. 2; fourth panel), we assumed that the dust emissivity and temperature are uniform over the source, but in reality, they are likely non-uniform. A radially decreasing temperature gradient (e.g. Walter et al. 2022) would imply an even higher central density of star formation than we inferred here. Multi-frequency dust continuum observations at matched angular resolution would be required to test whether there is such a temperature gradient and to compute the star formation rate density more robustly. While there is no clear evidence of an AGN in the broadband SED for this object (Bothwell et al. 2013), it cannot be ruled out. X-ray or radio observations (currently lacking) are warranted to test for the presence of radio jets or an accretion disc corona which definitively indicate AGN activity.
Future work should involve the analysis of a sample of lensed DSFGs observed at similar angular resolutions with ALMA to determine whether nuclear spirals are prevalent in this population. Crucially, we find that smoothing the source to the native resolution of the observations (30 mas) erases any evidence of the spiral morphology, suggesting that gravitational lensing is the only feasible approach to resolving these features. A prevalence of nuclear discs and bars in the DSFG population would indicate that these physical mechanisms help drive their intense star formation and mass growth.
Finally, a common concern when studying strongly lensed sources is that the results depend on a lens model that involves strong assumptions and poorly understood uncertainties. Here, our source error analysis addresses questions of source structure significance, such as whether individual clumps are genuine or noise artefacts. We find that changes in the regularisation type and additional lens model freedom in the form of angular structure do not significantly alter the inferred source properties, in agreement with the recent study with mock optical data by Galan et al. (2024). Furthermore, Stacey et al. (2024) find that the inclusion of angular structure in the lens model did not change the source structure compared to the canonical power-law plus external shear. While these results suggest that our findings are robust to lens modelling systematics, our analysis does not consider the effect of a mass sheet transform-like effect that may result if the lens is part of a group. This would reduce or inflate the size of the lensed source, along with its inferred star formation rate, without changing its structure (e.g. see the effect of including the foreground in Fig. 7 of Powell et al. 2022). It is unknown whether the lens of SPT 0538−50 is part of a group (Stacey et al. 2024), so we leave such investigation to future work.
5. Conclusions
We have shown how sophisticated gravitational lens modelling tools and long-baseline ALMA observations can be combined to produce observations with spatial resolution sufficient to resolve the inner structure of DSFGs. For SPT 0538−50, we find the central kiloparsec of the galaxy exhibits a dual spiral arm morphology and a potential nuclear bar that could facilitate gas inflow, feeding the nuclear starburst and supermassive black hole. These results show that our approach can be used to probe the physical drivers of spheroid formation at cosmologically interesting epochs. More definitive answers regarding the role of nuclear spirals in the structural evolution of DSFGs can only come from gas kinematics. Strong gravitational lensing magnification is the only feasible way to reach these physical scales. We have demonstrated that the lensed source reconstructions are robust to a combination of angular flexibility in the lens model and different choices of source regularisation. We find that the factors that limit the overall uncertainties on the lensed source properties are instrumental flux calibration and SED modelling.
Note that this method of creating an image via forward modelling results in significantly fewer artefacts than with the CLEAN algorithm.
Acknowledgments
Our analysis made use of NumPy, SciPy, Matplotlib, Astropy and Photutils packages for Python (Harris et al. 2020; Virtanen et al. 2020; Hunter 2007; Astropy Collaboration 2013, 2018; Bradley et al. 2023). We used ALMA data associated with project code 2016.1.01374.S. ALMA is a partnership of ESO (representing its member states), NSF (USA) and NINS (Japan), together with NRC (Canada), MOST and ASIAA (Taiwan), and KASI (Republic of Korea), in cooperation with the Republic of Chile. The Joint ALMA Observatory is operated by ESO, AUI/NRAO and NAOJ. This work is based on research supported in part by the National Research Foundation of South Africa (Grant Number: 128943).
References
- Amvrosiadis, A., Lange, S., Nightingale, J., et al. 2024, ArXiv e-prints [arXiv:2404.01918] [Google Scholar]
- Anglés-Alcázar, D., Quataert, E., Hopkins, P. F., et al. 2021, ApJ, 917, 53 [CrossRef] [Google Scholar]
- Astropy Collaboration (Robitaille, T. P., et al.) 2013, A&A, 558, A33 [NASA ADS] [CrossRef] [EDP Sciences] [Google Scholar]
- Astropy Collaboration (Price-Whelan, A. M., et al.) 2018, AJ, 156, 123 [Google Scholar]
- Audibert, A., Combes, F., García-Burillo, S., et al. 2019, A&A, 632, A33 [NASA ADS] [CrossRef] [EDP Sciences] [Google Scholar]
- Barcos-Muñoz, L., Leroy, A. K., Evans, A. S., et al. 2017, ApJ, 843, 117 [CrossRef] [Google Scholar]
- Bothwell, M. S., Aguirre, J. E., Chapman, S. C., et al. 2013, ApJ, 779, 67 [NASA ADS] [CrossRef] [Google Scholar]
- Bradley, L., Sipőcz, B., Robitaille, T., et al. 2023, https://doi.org/10.5281/zenodo.1035865 [Google Scholar]
- Buta, R., & Crocker, D. A. 1993, AJ, 105, 1344 [NASA ADS] [CrossRef] [Google Scholar]
- Casey, C. M., Narayanan, D., & Cooray, A. 2014, Phys. Rep., 541, 45 [Google Scholar]
- Combes, F., García-Burillo, S., Casasola, V., et al. 2013, A&A, 558, A124 [NASA ADS] [CrossRef] [EDP Sciences] [Google Scholar]
- Conselice, C. J. 2014, ARA&A, 52, 291 [CrossRef] [Google Scholar]
- Costantin, L., Pérez-González, P. G., Guo, Y., et al. 2023, Nature, 623, 499 [NASA ADS] [CrossRef] [Google Scholar]
- Davies, R. I., Maciejewski, W., Hicks, E. K. S., et al. 2009, ApJ, 702, 114 [NASA ADS] [CrossRef] [Google Scholar]
- Dekel, A., & Burkert, A. 2014, MNRAS, 438, 1870 [Google Scholar]
- Di Mascia, F., Carniani, S., Gallerani, S., et al. 2023, MNRAS, 518, 3667 [Google Scholar]
- Dobbs, C. L., Theis, C., Pringle, J. E., & Bate, M. R. 2010, MNRAS, 403, 625 [NASA ADS] [CrossRef] [Google Scholar]
- Englmaier, P., & Shlosman, I. 2000, ApJ, 528, 677 [NASA ADS] [CrossRef] [Google Scholar]
- Englmaier, P., & Shlosman, I. 2004, ApJ, 617, L115 [NASA ADS] [CrossRef] [Google Scholar]
- Erwin, P., Saglia, R. P., Fabricius, M., et al. 2015, MNRAS, 446, 4039 [Google Scholar]
- Foreman-Mackey, D., Hogg, D. W., Lang, D., & Goodman, J. 2013, PASP, 125, 306 [Google Scholar]
- Fraternali, F., Karim, A., Magnelli, B., et al. 2021, A&A, 647, A194 [NASA ADS] [CrossRef] [EDP Sciences] [Google Scholar]
- Gadotti, D. A., Athanassoula, E., Carrasco, L., et al. 2007, MNRAS, 381, 943 [NASA ADS] [CrossRef] [Google Scholar]
- Gadotti, D. A., Bittner, A., Falcón-Barroso, J., et al. 2020, A&A, 643, A14 [NASA ADS] [CrossRef] [EDP Sciences] [Google Scholar]
- Galan, A., Vernardos, G., Minor, Q., et al. 2024, A&A, 692, A87 [NASA ADS] [CrossRef] [EDP Sciences] [Google Scholar]
- García-Burillo, S., Combes, F., Schinnerer, E., Boone, F., & Hunt, L. K. 2005, A&A, 441, 1011 [NASA ADS] [CrossRef] [EDP Sciences] [Google Scholar]
- Gillman, S., Smail, I., Gullberg, B., et al. 2024, A&A, 691, A299 [NASA ADS] [CrossRef] [EDP Sciences] [Google Scholar]
- Harris, C. R., Millman, K. J., van der Walt, S. J., et al. 2020, Nature, 585, 357 [NASA ADS] [CrossRef] [Google Scholar]
- Hodge, J. A., & da Cunha, E. 2020, Royal Soc. Open Sci., 7, 200556 [NASA ADS] [CrossRef] [Google Scholar]
- Hodge, J. A., Smail, I., Walter, F., et al. 2019, ApJ, 876, 130 [Google Scholar]
- Hodge, J. A., da Cunha, E., Kendrew, S., et al. 2024, ApJ, submitted [arXiv:2407.15846] [Google Scholar]
- Hopkins, P. F., Bundy, K., Murray, N., et al. 2009, MNRAS, 398, 898 [Google Scholar]
- Hunter, J. D. 2007, Comput. Sci. Eng., 9, 90 [NASA ADS] [CrossRef] [Google Scholar]
- Jogee, S. 2006, Physics of Active Galactic Nuclei at all Scales, 693, 143 [NASA ADS] [CrossRef] [Google Scholar]
- Knapen, J. H., Beckman, J. E., Heller, C. H., Shlosman, I., & de Jong, R. S. 1995, ApJ, 454, 623 [NASA ADS] [CrossRef] [Google Scholar]
- Kretschmer, M., Dekel, A., & Teyssier, R. 2022, MNRAS, 510, 3266 [NASA ADS] [CrossRef] [Google Scholar]
- Kroupa, P. 2001, MNRAS, 322, 231 [NASA ADS] [CrossRef] [Google Scholar]
- Krumholz, M. R., Burkhart, B., Forbes, J. C., & Crocker, R. M. 2018, MNRAS, 477, 2716 [CrossRef] [Google Scholar]
- Kuhn, V., Guo, Y., Martin, A., et al. 2024, ApJ, 968, L15 [NASA ADS] [CrossRef] [Google Scholar]
- Le Conte, Z. A., Gadotti, D. A., Ferreira, L., et al. 2024, MNRAS, 530, 1984 [NASA ADS] [CrossRef] [Google Scholar]
- Lelli, F., Di Teodoro, E. M., Fraternali, F., et al. 2021, Science, 371, 713 [Google Scholar]
- Lelli, F., Davis, T. A., Bureau, M., et al. 2022, MNRAS, 516, 4066 [NASA ADS] [CrossRef] [Google Scholar]
- Lelli, F., Zhang, Z.-Y., Bisbas, T. G., et al. 2023, A&A, 672, A106 [NASA ADS] [CrossRef] [EDP Sciences] [Google Scholar]
- Liu, D., Förster Schreiber, N. M., Harrington, K. C., et al. 2024, Nat. Astron., 8, 1181 [CrossRef] [Google Scholar]
- Martini, P., Regan, M. W., Mulchaey, J. S., & Pogge, R. W. 2003, ApJS, 146, 353 [NASA ADS] [CrossRef] [Google Scholar]
- Mihos, J. C., & Hernquist, L. 1996, ApJ, 464, 641 [Google Scholar]
- Ndiritu, S., Vegetti, S., Powell, D. M., & McKean, J. P. 2024, ArXiv e-prints [arXiv:2407.19015] [Google Scholar]
- Planck Collaboration VI. 2020, A&A, 641, A6 [NASA ADS] [CrossRef] [EDP Sciences] [Google Scholar]
- Powell, D., Vegetti, S., McKean, J. P., et al. 2021, MNRAS, 501, 515 [Google Scholar]
- Powell, D. M., Vegetti, S., McKean, J. P., et al. 2022, MNRAS, 516, 1808 [NASA ADS] [CrossRef] [Google Scholar]
- Prieto, M. A., Fernandez-Ontiveros, J. A., Bruzual, G., et al. 2019, MNRAS, 485, 3264 [NASA ADS] [CrossRef] [Google Scholar]
- Reddish, J., Kraljic, K., Petersen, M. S., et al. 2022, MNRAS, 512, 160 [NASA ADS] [CrossRef] [Google Scholar]
- Reuter, C., Vieira, J. D., Spilker, J. S., et al. 2020, ApJ, 902, 78 [NASA ADS] [CrossRef] [Google Scholar]
- Ritondale, E., Vegetti, S., Despali, G., et al. 2019, MNRAS, 485, 2179 [Google Scholar]
- Rizzo, F., Vegetti, S., Fraternali, F., & Di Teodoro, E. 2018, MNRAS, 481, 5606 [Google Scholar]
- Rizzo, F., Vegetti, S., Fraternali, F., Stacey, H. R., & Powell, D. 2021, MNRAS, 507, 3952 [NASA ADS] [CrossRef] [Google Scholar]
- Rizzo, F., Roman-Oliveira, F., Fraternali, F., et al. 2023, A&A, 679, A129 [NASA ADS] [CrossRef] [EDP Sciences] [Google Scholar]
- Rizzo, F., Bacchini, C., Kohandel, M., et al. 2024, A&A, 689, A273 [NASA ADS] [CrossRef] [EDP Sciences] [Google Scholar]
- Roman-Oliveira, F., Fraternali, F., & Rizzo, F. 2023, MNRAS, 521, 1045 [NASA ADS] [CrossRef] [Google Scholar]
- Rybak, M., McKean, J. P., Vegetti, S., Andreani, P., & White, S. D. M. 2015, MNRAS, 451, L40 [Google Scholar]
- Sanders, D. B., & Mirabel, I. F. 1996, ARA&A, 34, 749 [Google Scholar]
- Sheth, K., Melbourne, J., Elmegreen, D. M., et al. 2012, ApJ, 758, 136 [NASA ADS] [CrossRef] [Google Scholar]
- Shlosman, I., Frank, J., & Begelman, M. C. 1989, Nature, 338, 45 [Google Scholar]
- Stacey, H. R., McKean, J. P., Powell, D. M., et al. 2021, MNRAS, 500, 3667 [Google Scholar]
- Stacey, H. R., Powell, D. M., Vegetti, S., et al. 2024, A&A, 688, A110 [NASA ADS] [CrossRef] [EDP Sciences] [Google Scholar]
- Toomre, A. 1981, Structure and Evolution of Normal Galaxies, 111 [Google Scholar]
- Tsukui, T., & Iguchi, S. 2021, Science, 372, 1201 [NASA ADS] [CrossRef] [Google Scholar]
- Tsukui, T., Wisnioski, E., Bland-Hawthorn, J., et al. 2024, MNRAS, 527, 8941 [Google Scholar]
- Vegetti, S., & Koopmans, L. V. E. 2009, MNRAS, 392, 945 [Google Scholar]
- Virtanen, P., Gommers, R., Oliphant, T. E., et al. 2020, Nat. Methods, 17, 261 [Google Scholar]
- Walter, F., Neeleman, M., Decarli, R., et al. 2022, ApJ, 927, 21 [NASA ADS] [CrossRef] [Google Scholar]
- Yu, S.-Y., Kalinova, V., Colombo, D., et al. 2022a, A&A, 666, A175 [NASA ADS] [CrossRef] [EDP Sciences] [Google Scholar]
- Yu, S.-Y., Xu, D., Ho, L. C., Wang, J., & Kao, W.-B. 2022b, A&A, 661, A98 [NASA ADS] [CrossRef] [EDP Sciences] [Google Scholar]
All Figures
|
Fig. 1. Image of SPT 0538−50 at 350 GHz. The inset shows a zoomed-in view of the southern image with signal-to-noise ratio contours in steps of 3, |
| In the text | |
|
Fig. 2. Reconstructed dust continuum of SPT 0538−50. Top to bottom rows: Gradient, curvature, and area-weighted gradient regularisation types, all with the same colour scales. First column: Surface brightness (the area below 3σ significance has been masked, where σ accounts for the noise, artefacts in the data, and the non-linear effects of lensing); contours are in steps of 0.02 Jy arcsec2, and the dashed grey lines show the tangential caustics. Second column: Magnification with signal-to-noise ratio contours in steps of 3σ. Third column: Effective magnification-corrected beam FWHM in the source plane with signal-to-noise ratio contours. Fourth column: Star formation rate surface density and caustics in grey. Ellipses in the bottom-left corner show three magnification-corrected beams in the source plane for |
| In the text | |
|
Fig. 3. Sérsic and isophote fits of SPT 0538−50 (curvature regularisation). Left: Noise-normalised residuals of the Sérsic fit in solid contours with steps of 3. Right: Reconstructed source with isophotes overplotted. The grey dashed lines show the position angle of the isophotes at 0.25 and 0.5 arcsec semi-major axis radii; the black line shows the position angle of the Sérsic. |
| In the text | |
|
Fig. 4. Ellipticity (top; where q is the axis ratio) and position angle (bottom; defined east of north) of isophotes fitted to the reconstructed source of SPT 0538−50. The shaded coloured regions are the standard deviations of the fits and the grey area shows the median beam FWHM in the source plane. The dashed grey line shows the effective radius of the Sérsic fit. The swing in position angle by 45 deg may be due to a nuclear bar. |
| In the text | |
Current usage metrics show cumulative count of Article Views (full-text article views including HTML views, PDF and ePub downloads, according to the available data) and Abstracts Views on Vision4Press platform.
Data correspond to usage on the plateform after 2015. The current usage metrics is available 48-96 hours after online publication and is updated daily on week days.
Initial download of the metrics may take a while.