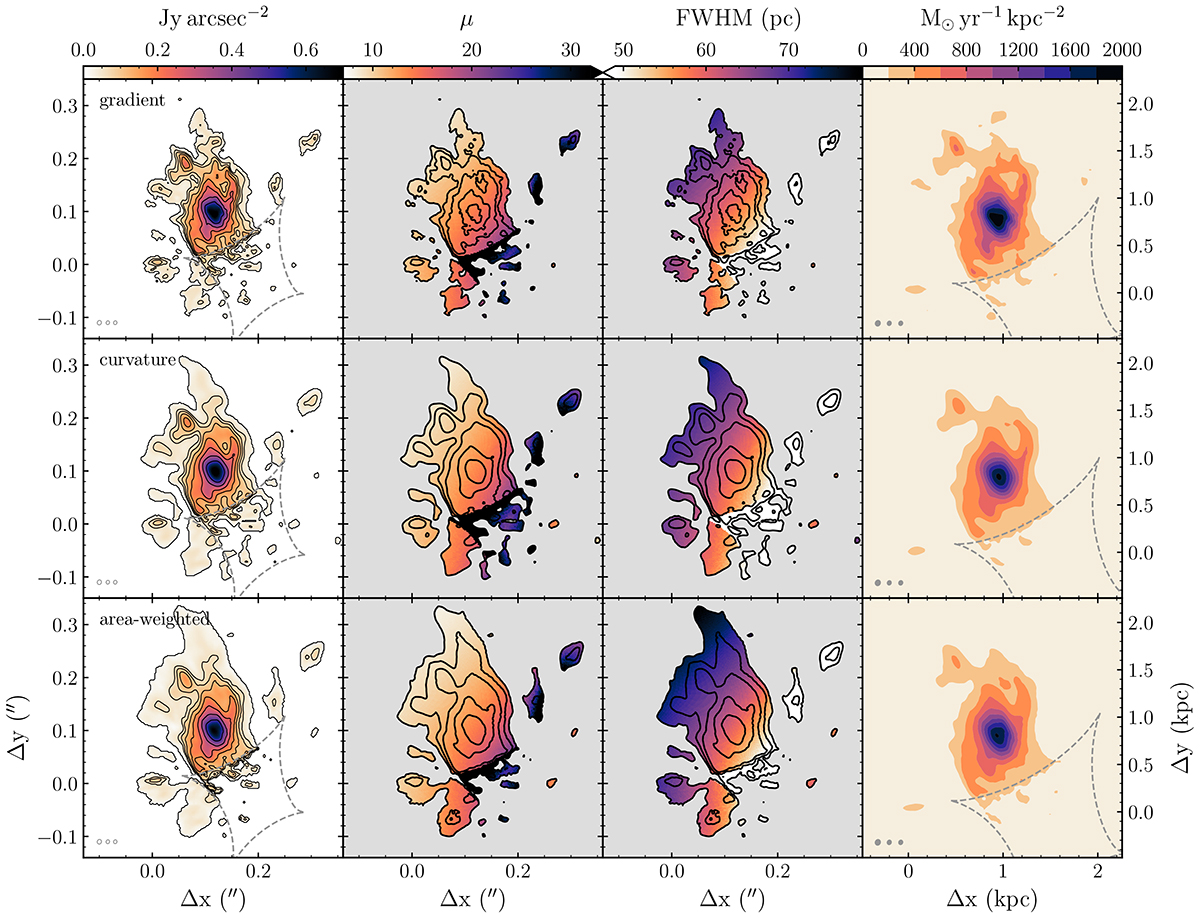
Fig. 2.
Download original image
Reconstructed dust continuum of SPT 0538−50. Top to bottom rows: Gradient, curvature, and area-weighted gradient regularisation types, all with the same colour scales. First column: Surface brightness (the area below 3σ significance has been masked, where σ accounts for the noise, artefacts in the data, and the non-linear effects of lensing); contours are in steps of 0.02 Jy arcsec2, and the dashed grey lines show the tangential caustics. Second column: Magnification with signal-to-noise ratio contours in steps of 3σ. Third column: Effective magnification-corrected beam FWHM in the source plane with signal-to-noise ratio contours. Fourth column: Star formation rate surface density and caustics in grey. Ellipses in the bottom-left corner show three magnification-corrected beams in the source plane for ![]() ,
, ![]() , and
, and ![]() , where
, where ![]() is the mean and σμ is the standard deviation.
is the mean and σμ is the standard deviation.
Current usage metrics show cumulative count of Article Views (full-text article views including HTML views, PDF and ePub downloads, according to the available data) and Abstracts Views on Vision4Press platform.
Data correspond to usage on the plateform after 2015. The current usage metrics is available 48-96 hours after online publication and is updated daily on week days.
Initial download of the metrics may take a while.