| Issue |
A&A
Volume 693, January 2025
|
|
|---|---|---|
| Article Number | L19 | |
| Number of page(s) | 8 | |
| Section | Letters to the Editor | |
| DOI | https://doi.org/10.1051/0004-6361/202452498 | |
| Published online | 24 January 2025 | |
Letter to the Editor
Spectral and photometric characterization of (98943) Torifune in preparation for the Hayabusa2# spacecraft flyby
1
INAF – Osservatorio Astronomico di Roma, Via Frascati 33, I-00078 Monte Porzio Catone, Italy
2
LESIA, Observatoire de Paris, Université Paris Cité, Université PSL, CNRS, Sorbonne Université, 5 place Jules Janssen, 92195 Meudon, France
3
Institut Universitaire de France (IUF), 1 rue Descartes, 75231 Paris Cedex 05, France
4
Department of Physics and Astronomy, Seoul National University, Gwanak-gu, Seoul, 08826
Republic of Korea
5
SNU Astronomy Research Center, Seoul National University, Gwanak-gu, Seoul, 08826
Republic of Korea
6
Institute of Space and Astronautical Science, Japan Aerospace Exploration Agency, 3-1-1 Yoshinodai, Chuo-ku, Sagamihara, Kanagawa, 252-5210
Japan
7
Department of Computer Science and Engineering/Division of Information Systems, The University of Aizu, Aizu-Wakamatsu, Fukushima, 965-8580
Japan
8
Japan Spaceguard Association, Bisei Spaceguard Center 1716-3 Okura, Bisei, Ibara, Okayama, 714-1411
Japan
9
INAF Istituto di Astrofisica e Planetologia Spaziali, Via del Fosso del Cavaliere 100, I-00133 Rome, Italy
10
Georgia Institute of Technology, Atlanta, GA, USA
⋆ Corresponding author; This email address is being protected from spambots. You need JavaScript enabled to view it.
Received:
4
October
2024
Accepted:
27
December
2024
Abstract
Context. After a successful sample-return mission to the asteroid (162173) Ryugu, the Hayabusa2 spacecraft is currently on its way to encounter two near-Earth asteroids: (98943) Torifune (formerly known as 2001 CC21) and 1998 KY26.
Aims. In this article, we study the asteroid (98943) Torifune, the first object that is to be visited by the spacecraft during its extended mission. To prepare for its encounter with the spacecraft, it is crucial to study this object from Earth. We conducted several ground-based observations to characterize this asteroid and understand its mineralogy.
Methods. In January and February 2023, we carried out spectroscopic and photometric observations at the 2.56 m Nordic Optical Telescope, in the visible and near-infrared ranges, covering different rotational phases of the asteroid.
Results. Based on spectra analysis in the visible and near-infrared ranges, confirmed by the color studies, we determined that Torifune belongs to the Sq-type, according the Bus-DeMeo taxonomy. Assuming this taxonomy and its equivalent diameter (D ∼ 465 ± 15 m), we estimated the mass of this asteroid to be 1.81 ± 0.11 × 10¹¹ kg. In term of mineralogy, we found a close match with ordinary L chondrites.
Conclusions. As our observations covered almost a complete rotation phase, we did not find any spectral variation at different rotational phases, meaning that there is no substantial heterogeneities on Torifune’s surface. We compared the spectral slope of (98943) Torifune with that of the S-complex members of the Lucienne family. However, further studies, especially dynamical ones, are needed to confirm whether this object originates from the Lucienne family.
Key words: methods: observational / techniques: photometric / techniques: spectroscopic / telescopes / minor planets / asteroids: general
© The Authors 2025
 Open Access article, published by EDP Sciences, under the terms of the Creative Commons Attribution License (https://creativecommons.org/licenses/by/4.0), which permits unrestricted use, distribution, and reproduction in any medium, provided the original work is properly cited.
This article is published in open access under the Subscribe to Open model. This email address is being protected from spambots. You need JavaScript enabled to view it. to support open access publication.
1. Introduction
Hayabusa2 was a sample-return mission launched in December 2014 with a key objective to study and collect samples from the near-Earth asteroid (162173) Ryugu. After two touchdowns, the spacecraft collected over 5.5 g of surface materials, which were returned to Earth in December 2020 (Yada et al. 2021).
The mission has been extended under the name Hayabusa2# (where the # symbol stands for SHARP: Small Hazardous Asteroid Reconnaissance Probe) to perform two encounters with other near-Earth asteroids (Hirabayashi et al. 2021). Therefore, in July 2026, the spacecraft will conduct a flyby of the near-Earth asteroid (98943) Torifune (provisional designation 2001 CC21) and a rendezvous with 1998 KY26 in July 2031. After the nominal mission, four instruments remain operational on board of the spacecraft and three of them will be activated during the flyby of (98943) Torifune: Near Infrared Spectrometer (NIRS3) (Iwata et al. 2017), Optical Navigation Camera (ONC) (Suzuki et al. 2018), and Thermal Infrared Imager (TIR) (Okada et al. 2017).
This article presents our study of the first target of Hayabusa2#: the aforementioned (98943) Torifune. Spectroscopically, this asteroid has been classified as L-type (Binzel et al. 2004) or S-complex (Lazzarin et al. 2005; DeMeo et al. 2009). Its rotational period has been estimated to be 5.02 hours (Hirabayashi et al. 2021; Fornasier et al. 2024). Recently, Geem et al. (2023) and Fornasier et al. (2024) performed several observations of this object, using polarimetric, near-infrared (NIR) spectroscopic, and thermal data to characterize Torifune, finding albedo and physical properties consistent with S-complex asteroid. Fornasier et al. (2024) found a geometric albedo of 21.6 ± 1.6% and a diameter of 465 ± 15 m.
In this paper, we present our work on Torifune, focusing on spectroscopic and multi-filter photometric observations. In Sect. 2, we describe the data acquisition conducted with ground-based telescope, including the observing strategy and the data reduction processes. In Sect. 3, we present the results regarding the characterization of Torifune, including spectral, color, and mineralogical studies. Finally, in Sect. 4, we interpret these results, particularly in the context of the surface properties of Torifune and its potential origin.
2. Data acquisition
We observed (98943) Torifune in January and February 2023, when its visual magnitude was 17–18 (according to the ephemeris). During this period, we conducted spectroscopic and photometric observations in the visible and NIR ranges, covering most of its rotational period. Table A.3 summarizes all the observations we made for Torifune.
We obtained data over three nights during January-February 2023 at the 2.56 m Nordic Optical Telescope (NOT), located in la Palma, Spain. Visible observations were conducted using the ALFOSC (ALhambra Faint Object Spectrograph and Camera) instrument. For the spectroscopic observations, we employed the grism#4 with the 1.8″slit and the blocking filter GG475. With this setup, we obtained spectra in the 0.48–0.92 μm range at a spectral resolution of ∼300. Additionally, during these nights, we observed several G2V-analog stars (hereafter referred to as SA stars), which will serve to remove the solar contribution from the asteroid spectra (Hardorp 1978). For photometric observations, we observed Torifune through R and V filters. Alongside the asteroid, we observed several standard stars at different air masses to chart the intensity variation of stars during the night, using the same filters as those used for observing Torifune. The NIR observations at NOT were conducted solely for photometry. We used the 1024 × 1024 pixel NOTCam near-infrared detector with the J and H filters. Each target was observed at five different detector positions and combined to better correct the atmospheric contribution. Additionally, prior to the observations, standard calibration data were acquired in daytime, including flat-field, bias, and wavelength calibration files. These data were then used for the data reduction, as explained in Appendix C.
In total, we obtained ten visible spectra (presented in Fig. B.1) and five photometric data points. In Fig. B.2, we present the combined spectra with the near infrared spectrum provided by Geem et al. (2023), along with the average visible spectra from our observations in January and February. In the same figure, we also plot the four points from our color studies, derived from our photometric observations. As we had two datasets taken with the R filter, we chose the first one, as it was closest in time to the data taken with the V filter (i.e., the first R data). We report in Table A.1 the estimated values of magnitude from our observations.
3. Results
Once the data were reduced, we conducted several analyses to characterize the spectral parameters and surface mineralogy of Torifune. We merged our visible spectra taken in January 2023 with the NIR part taken by Geem et al. (2023) as both the visible and NIR spectra were obtained at similar phase angles, around 30°. In Appendix C.1, we describe the merging process between the two parts of the spectrum. We report all the results in Table 1.
(98943) Torifune parameters found in this study and/or in the literature.
3.1. Taxonomy and mass estimation
The first step was to determine the taxonomy of Torifune, following the Bus-DeMeo taxonomy (DeMeo et al. 2009). We utilized the Modeling For Asteroids (M4AST) 1 tool (Popescu et al. 2012), which compares our spectra with the average spectra of different classes in the Bus-DeMeo taxonomy using the least χ2 method.
We found that all the data spectra were well matched with the S-complex, specifically with the Sq-types. Additionally, the second and third-best matches were consistent between both spectra, corresponding to S-type and Sr-type, respectively. We observed the presence of the 1.0 μm-band, which excludes this object from being classified as an L-type asteroid, as suggested by Binzel et al. (2004).
Following that result, we computed Torifune’s mass, using the method describe in Appendix D. We obtained an estimate of the asteroid’s mass as 1.81 ± 0.11 × 10¹¹ kg. This result is a preliminary estimate, as we did not consider several parameters such as the macro-porosity or the shape of the asteroid.
3.2. Spectral parameters
The second step involved computing the spectral slopes of Torifune’s visible spectra. We observed a slight difference in the spectral slope values (computed in the 0.50–0.75 μm range), with 10.312 ± 0.548%/1000 Å, (for data taken in January) and 10.468 ± 0.525%/1000 Å (for data taken in February). Considering the phase reddening coefficient reported in Perna et al. (2018) for S-complex NEAs (0.013%/1000 Å), the difference in the spectral slope of the two observations (acquired 40° in phase angle apart) may be attributed to phase reddening.
We computed the spectral parameters such as the center of the band at 1 μm and 2 μm (respectively referred as BI and BII), the band area ratio (BAR), following the Gaffey et al. (1993) method and using the M4AST tool. From these values, we applied the temperature correction for the BAR, as described in Dunn et al. (2013). However, we did not apply the correction for the BI center because, in their study, the standard deviation of this parameter after correction for Torifune is zero. Furthermore, we used the equation provided by Dunn et al. (2010) to calculate the proportion of olivine in a mixture of olivine and pyroxene ( ). We found that Torifune’s surface contains 61.23 ± 1.11 % olivine. The and parameters and olivine proportion are presented in Table 1, while the distribution of Torifune’s band parameters is shown in Fig. 1, with the BI center versus BAR and in the BI center versus BII center. From these plots, we observed that the band parameters for both spectra fall within the range characterizing a mineralogy consistent with that of the ordinary chondrites of L or LL-type.
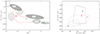 |
Fig. 1. Distribution of Torifune band parameter in the BI center versus BAR plan and BI versus BII. The red area, in the figure on the left, represents the region characterized by ordinary chondrites. |
3.3. Comparison with meteorites
To further investigate the surface composition of Torifune, we compared the two spectra with those of meteorites in the RELAB database (Pieters 1983). We used the M4AST tool, which carries out a curve-matching process between the asteroid and meteorites using the least χ2 method. Among the first fifty matches, we carefully examined each one. Figure 2 presents the best result we obtained, with the meteorite OC-L6 Chateau Renard.
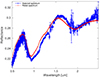 |
Fig. 2. Comparison between Torifune spectra and the meteorite L6 Chateau Renard from the RELAB database. |
The best-fit sample (OC-TXH-011-D15) underwent irradiation with a laser to simulate the space weathering alterations that occur on an asteroid’s surface (Hasegawa et al. 2019). While this match suggests a similarity, we cannot definitively conclude that Torifune is the parent body of this meteorite. However, it indicates that the surface composition of Torifune may resemble that of the Chateau Renard meteorite, specifically an ordinary chondrite L6. Furthermore, considering that the meteorite sample was irradiated with a 5mJ laser and is composed by on a 125 μm pellets, the good match suggests that the surface of Torifune may have undergone significant space weathering, along with a substantial presence of regolith.
3.4. Color studies
We reported the magnitudes and color values in Tables A.1 and A.2, respectively. We compared our results with the average spectrum obtained from the nights of January and February 2023 (see Fig. B.2).
We observed a good match between the color values and our two visible spectra. More specifically, we found a V–R value of 0.423 ± 0.016, which aligns with the values reported by Fornasier et al. (2024), ranging between 0.39 and 0.47. In the NIR range, we also found a good correlation between the color values and the spectra of Torifune. This agreement between photometric and spectroscopic results reinforces our taxonomical classification.
4. Discussion
4.1. Surface homogeneity
Thanks to our two observational runs, we obtained data covering most of Torifune’s rotational phase. Consequently, we have the ability to detect potential surface heterogeneity (or homogeneity) by examining periodic variations among the different spectra obtained. We plotted the values of the visible slope against the rotational phase (Fig. 3), assuming a rotational period of 5.02124 ± 0.00001 hours (Fornasier et al. 2024). As the January and February 2023 observations were acquired at phase angles of 30.4° and 71.6°, respectively, we should consider the phase reddening correction before comparing the observations acquired at different rotational phase. Therefore, we applied a correction factor, provided by Perna et al. (2018), of γS = 0.013 ± 0.009%/1000 Å°, to the spectrum taken in February, allowing us to compare it with the one of January (acquired at a phase angle of 30.4°).
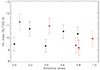 |
Fig. 3. Distribution of the visible spectral slope value according to the normalized rotational phase. Black points represent all the spectra taken in January 2023 while red points correspond to spectra taken in February 2023. |
Before interpreting the results, it is essential to assess the consistency of our data. We observed good agreement for overlapping points between the January and February 2023 observations, considering the uncertainties. This consistency suggests that we have adequate data coverage for Torifune’s entire rotational period. We observe that all the points are around the 10.5%/1000 Å. Therefore, the lack of significant variation suggests that (98943) Torifune does not exhibit large surface heterogeneity detectable from our dataset.
4.2. Origin of (98943) Torifune
During the meteorite comparison work, after the first step (which sorted all the meteorite spectra by accounting for the asteroid’s geometric albedo in the reflectance range of the meteorite spectra), we observed that most of the remaining spectra corresponded to ordinary chondrites of all types (H, L, and LL). Furthermore, most of these ordinary chondrites had a petrologic grade ranging from 4 to 6 (Van Schmus & Wood 1967). This suggests that the mineralogy of Torifune underwent metamorphic alteration rather than an aqueous alteration. Thus, we hypothesize that Torifune’s parent body formed in a region where the majority of primordial S-complex planetesimals accreted (Vernazza et al. 2014). According to this study, L and LL chondrites formed closer to the Sun (at 2 AU or less) than H chondrites (around 2.5 AU).
To further identify Torifune’s parent body or family of origin, we compared the spectral slope of Torifune with the average one of inner main belt S-type families, between 0.50 and 0.75 μm. To calculate these spectral slopes, we used members lists of these families provided by Nesvorný (2005) and Bourdelle de Micas et al. (2024) (for the recently discovered primordial S-type family). From these lists, we used the asteroids spectrophotometry published in the Gaia DR3 release Gaia Collaboration (2023).
First, we identified all objects belonging to the S-complex, excluding those of X-complex, C-complex, and other non-silicated types. Next, for the remaining asteroids, we calculated their spectral slope between 0.50 and 0.75 μm. Finally, for each family, we estimated the median value of this parameter along with their uncertainties and compared them to that of Torifune. The latter represent the mean value of all spectra taken during the January observation. We present this result in Table 2.
Comparison of the mean spectral slope value in the visible range between S-complex inner main-belt families and (98943) Torifune.
In making this comparison, it is important to consider the phase angle value at the time of the observation. For Gaia’s data, the phase angle value of the observed main-belt asteroids is around 20° (Gaia Collaboration 2023). For our data, the January observations were made at 30.4°, while the February observations were made at 71.6°. Additionally, in Sanchez et al. (2012) demonstrated that the effect of phase angle on the spectral slope of ordinary chondrite spectra is less significant at low phase angle (between 13° and 30°). Since most Gaia spectra were taken at 20°, the spectral slope comparison is more relevant when considering our spectra of January 2023.
We found that Torifune appears to be more closely related to two inner main-belt families: Lucienne and Phocaea. However, the association with the Phocaea family is unexpected, as this family is known to be the potential parent body of H chondrites (Noonan et al. 2019). This finding is incompatible with our mineralogical analysis results (see Fig. 1), which indicate that Torifune has a surface composition similar to that of ordinary chondrites L or LL. Consequently, we can exclude Phocaea family as potential origin for Torifune, leaving only Lucienne family.
However, the Lucienne family has not been extensively studied in the literature, particularly regarding its surface mineralogical composition. We cannot definitely conclude that Torifune originates from this family, as spectral slopes alone are insufficient to establish a definitive link between an asteroid and its origins. To clearly identify the parent body of Torifune, further studies are needed, particularly dynamical studies.
5. Conclusion
We conducted ground-based spectroscopic and photometric observations of (98943) Torifune between January and February 2023. Spectra analysis revealed that this asteroid belongs to the S complex, specifically the Sq type. A surface mineralogy analysis, including band parameters and meteorite analog matching, has indicated a similarity with ordinary chondrite L or LL, with significant metamorphic alteration. Using its equivalent diameter value and based on its taxonomy, we estimated its mass to be 1.81 ± 0.11 × 10¹¹ kg. No significant spectral variations were observed, meaning that Torifune should not have large heterogeneities on its surface.
By comparing the spectral features of inner main-belt families with the spectra of Torifune, we found a correlation with the Lucienne family, suggesting that this family may be the progenitor of Torifune. Dynamical studies are needed to confirm or refute this hypothesis.
Acknowledgments
Based on observations made with the Nordic Optical Telescope, owned in collaboration by the University of Turku and Aarhus University, and operated jointly by Aarhus University, the University of Turku and the University of Oslo, representing Denmark, Finland and Norway, the University of Iceland and Stockholm University at the Observatorio del Roque de los Muchachos, La Palma, Spain, of the Instituto de Astrofisica de Canarias. This work received financial support from the Italian Space Agency (ASI) under contract No. 2022-12-HH.0 and 2022-1-HH.0. S.F and M.A. B. thanks CNES for financial support. S.H. was supported by the Hypervelocity Impact Facility (former name: the Space Plasma Laboratory), ISAS, JAXA.
References
- Banse, K., Crane, P., Grosbol, P., et al. 1983, The Messenger, 31, 26 [NASA ADS] [Google Scholar]
- Binzel, R. P., Rivkin, A. S., Stuart, J. S., et al. 2004, Icarus, 170, 259 [NASA ADS] [CrossRef] [Google Scholar]
- Bourdelle de Micas, J., Fornasier, S., Delbo, M., et al. 2024, A&A, 682, A64 [NASA ADS] [CrossRef] [EDP Sciences] [Google Scholar]
- Carry, B. 2012, Planet. Space Sci., 73, 98 [CrossRef] [Google Scholar]
- Casagrande, L., Ramírez, I., Meléndez, J., & Asplund, M. 2012, ApJ, 761, 16 [NASA ADS] [CrossRef] [Google Scholar]
- Cloutis, E. A., Gaffey, M. J., Jackowski, T. L., & Reed, K. L. 1986, J. Geophys. Res., 91, 11 641 [Google Scholar]
- DeMeo, F. E., Binzel, R. P., Slivan, S. M., & Bus, S. J. 2009, Icarus, 202, 160 [Google Scholar]
- Dunn, T. L., McCoy, T. J., Sunshine, J. M., & McSween, H. Y. 2010, Icarus, 208, 789 [NASA ADS] [CrossRef] [Google Scholar]
- Dunn, T. L., Burbine, T. H., Bottke, W. F., & Clark, J. P. 2013, Icarus, 222, 273 [NASA ADS] [CrossRef] [Google Scholar]
- Fornasier, S., Clark, B. E., & Dotto, E. 2011, Icarus, 214, 131 [NASA ADS] [CrossRef] [Google Scholar]
- Fornasier, S., Dotto, E., Panuzzo, P., et al. 2024, A&A, 688, L7 [NASA ADS] [CrossRef] [EDP Sciences] [Google Scholar]
- Gaffey, M. J., Bell, J. F., Brown, R. H., et al. 1993, Icarus, 106, 573 [NASA ADS] [CrossRef] [Google Scholar]
- Gaia Collaboration (Galluccio, L., et al.) 2023, A&A, 674, A35 [NASA ADS] [CrossRef] [EDP Sciences] [Google Scholar]
- Geem, J., Ishiguro, M., Granvik, M., et al. 2023, MNRAS, 525, L17 [NASA ADS] [CrossRef] [Google Scholar]
- Hardorp, J. 1978, A&A, 63, 383 [NASA ADS] [Google Scholar]
- Hasegawa, S., Hiroi, T., Ohtsuka, K., et al. 2019, PASJ, 71, 103 [NASA ADS] [CrossRef] [Google Scholar]
- Hirabayashi, M., Mimasu, Y., Sakatani, N., et al. 2021, Adv. Space Res., 68, 1533 [NASA ADS] [CrossRef] [Google Scholar]
- Iwata, T., Kitazato, K., Abe, M., et al. 2017, Space Sci. Rev., 208, 317 [Google Scholar]
- Lazzarin, M., Marchi, S., Magrin, S., & Licandro, J. 2005, MNRAS, 359, 1575 [Google Scholar]
- Nesvorný, D., in Asteroids IV, 297 [Google Scholar]
- Noonan, J. W., Reddy, V., Harris, W. M., et al. 2019, AJ, 158, 213 [NASA ADS] [CrossRef] [Google Scholar]
- Okada, T., Fukuhara, T., Tanaka, S., et al. 2017, in 48th Annual Lunar and Planetary Science Conference, Lunar and Planetary Science Conference, 1818 [Google Scholar]
- Perna, D., Barucci, M. A., Fulchignoni, M., et al. 2018, Planet. Space Sci., 157, 82 [CrossRef] [Google Scholar]
- Pieters, C. M. 1983, J. Geophys. Res., 88, 9534 [NASA ADS] [CrossRef] [Google Scholar]
- Popescu, M., Birlan, M., & Nedelcu, D. A. 2012, A&A, 544, A130 [NASA ADS] [CrossRef] [EDP Sciences] [Google Scholar]
- Sanchez, J. A., Reddy, V., Nathues, A., et al. 2012, Icarus, 220, 36 [CrossRef] [Google Scholar]
- Suzuki, H., Yamada, M., Kouyama, T., et al. 2018, Icarus, 300, 341 [NASA ADS] [CrossRef] [Google Scholar]
- Van Schmus, W. R., & Wood, J. A. 1967, Geochim. Cosmochim. Acta, 31, 747 [NASA ADS] [CrossRef] [Google Scholar]
- Vernazza, P., Zanda, B., Binzel, R. P., et al. 2014, ApJ, 791, 120 [NASA ADS] [CrossRef] [Google Scholar]
- Yada, T., Abe, M., Okada, T., et al. 2021, Nat. Astron., 6, 214 [Google Scholar]
Appendix A: Additional tables
Observed magnitudes with observational conditions and applied filters.
Computed color values of (98943) Torifune.
Observational conditions of (98943) Torifune at the NOT telescope.
Appendix B: Additional figures
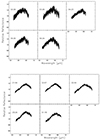 |
Fig. B.1. Visible spectra of (98943) Torifune taken in January (top) and February (bottom) 2023. |
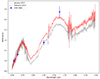 |
Fig. B.2. Comparison between color studies and spectra. In gray, spectra taken during the run of January 2023 (run #1), and, in red, spectra taken during the run of February 2023 (run #3). |
Appendix C: Data reduction
C.1. Spectroscopy
For spectroscopic data, we followed the standard reduction procedure using the ESO-Midas package (Banse et al. 1983). This procedure includes bias subtraction, flat-field correction, cosmic ray removal, atmospheric extinction correction, and wavelength calibration. To calculate the reflectance of the asteroids, we applied the same methods as described in Bourdelle de Micas et al. (2024), using only solar analog stars (with a spectral type G2V). In summary, we divided the signal of the asteroid (in our case that of Torifune) by that of the SA star. The final spectra are normalized to unity at 0.55 μm. Figure B.1 presents the eleven spectra after this reduction process.
As we observed (98943) Torifune five times in January 2023 and five times in February 2023, we calculated a median spectrum for each night from all the data taken on the same day.
We merged the visible spectra with the near-infrared data obtained from Geem et al. (2023). We performed a superposition at a common wavelength between the two parts, around 0.85 and 0.90 μm. We normalized both parts by their corresponding values at this wavelength (at ±0.02 μm). Finally, we conducted a visual inspection to verify that the junction respects the apparent continuum. We present these resulted spectra in Fig.B.2.
C.2. Photometry
For both visible and near-infrared images, we applied the standard reduction processes using our own Python scripts. This included calibration corrections (bias and flat-field) and the removal of cosmic rays.
To combine the different images taken in the near-infrared, we followed these steps: (1) we identified the positions of the object’s centroid in each image, (2) we subtracted each image by the next (in the case of the last image, we subtracted it by the first in the set), (3) we superimposed the images so that the position of the object’s centroid coincided with that of the first image in the set. Then, we applied the standard reduction processes, including the computation of the zero point and the determination of the atmospheric extinction coefficient, using standard stars observed on the same night with the same filters. We report the estimated values of magnitude in Table A.1.
Appendix D: Mass estimation
Assuming that Torifune belongs to the Sq-type and with the estimated value of Torifune’s equivalent diameter D = 465 ± 15 m (Fornasier et al. 2024), we estimated the mass of Torifune. We applied the following equation:
 (D.1)
(D.1)
where ρ is the density value of a Sq-type asteroid taken from Carry (2012) (ρ = 3430 ± 200 kg/m3).
Appendix E: Computation of the spectral parameters
The spectra of Torifune contain two absorption bands: the first (BI) around 1.0 μm, resulting from the presence of olivine and pyroxene, and the second (BII) around 2.0 μm, which characterizes the presence of pyroxene (Cloutis et al. 1986; Gaffey et al. 1993). Therefore, studying these bands provided clues about the surface mineralogy, such as the ratio of olivine and pyroxene. The computation of these parameters followed the method described by Gaffey et al. (1993), and were performed using the M4AST tool (Popescu et al. 2012).
Additionally, we computed the area values characterizing the band. To do this, we estimated the linear continuum between the band borders (between 0.75 and 1.55 μm for BI and 1.55 and 2.50 μm for BII). We then determined the area under that continuum and the area under the polynomial fit using the trapezoid method. The area value was obtained by subtracting the two quantities. For uncertainties, we applied the same method, using the n-1 and n+1 orders during the determination of the polynomial fit. Thus, we computed the difference in the final value using the n-1 and n+1 orders compared to the value obtained using the n order. To double-check our results, we used the M4AST tool, which determines the center of the bands and the Band Area Ratio (BAR), as well.
After characterizing these parameters, we applied the corrections from Dunn et al. (2013), to account for the effect of the surface temperature on the BAR. We assumed that Torifune’s surface composition is dominated by ordinary chondrites L, based on our study of band parameters, unaffected by surface temperature corrections (BI center versus BII center; see Fig.1, right) and the meteorite matching. Consequently, we used the following equation from Dunn et al. (2013):
 (E.1)
(E.1)
where BAR is the initial value of the BAR obtained with M4AST, and T is the surface temperature, equal to 248 K according to Dunn et al. (2013). Table 1 presents the corrected BAR value along with its uncertainty.
After applying these corrections, we calculated the proportions of fayalite in olivine (Fa) and ferrosilite in pyroxene (Fs) using the equations from Dunn et al. (2010):
 (E.2)
(E.2)
 (E.3)
(E.3)
The results of these calculations are presented in Table 1. These two parameters were then plotted as Fa versus  and Fs versus
  , following Dunn et al. (2010), to further characterize the mineral composition of Torifune (Fig.E.1). In these plots, we confirmed that the surface mineralogy is consistent with ordinary chondrites L or LL.
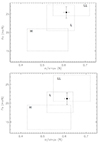 |
Fig. E.1. Distribution of Torifune ratio of fayalite versus the ration of olivine and ratio of ferrosilite versus the ratio of olivine. Each square represents a type of ordinary chondrites. |
Appendix F: Meteorite matching
To perform the meteorite matching, we proceeded in two steps. First, we considered the value of the geometric albedo of Torifune (pv = 21.6 ± 1.6% Fornasier et al. (2024)) and compared it with the reflectance value of the meteorite spectra at 0.55 μm. We consider a meteorite spectrum relevant if its reflectance value matched the geometric albedo, with a maximum deviation of 5% (Fornasier et al. 2011).
From the remnant spectra, in a second time, we visually inspected each of them, verifying that the bands (shape, center, depth) and spectral slopes of the meteorites corresponded closely to those of Torifune. The result of this matching is presented in Fig. 2.
Appendix G: Computation of the color
To calculate the color values, we followed the standard procedures. To convert the measured magnitude for a given filter into reflectance, we used the following equation:
![Mathematical equation: $$ \begin{aligned} R(\lambda )=10^{\ 0.4 \times [(V-F) - (V-F)_{\odot }]} ,\end{aligned} $$](/articles/aa/full_html/2025/01/aa52498-24/aa52498-24-eq9.gif) (G.1)
(G.1)
where V and F represent the measured magnitudes with the filters V and F, respectively, (with F corresponding to the specific filter used during our observations, i.e., R, J, or H). V⊙ and F⊙ correspond to the magnitude of the Sun at the respective filters. For the latter, we used the values provided by Casagrande et al. (2012), as presented in Table A.2. We considered only the V value from the observations of February to ensure temporal proximity to the data obtained with the other filters. Following this same criteria, we selected the closest data in the other filter to the chosen V filter. We normalized the result of Eq.G.1 to unity at 0.535 μm, corresponding to the center wavelength of the V filter. Regarding uncertainties, we used the standard error propagation from Eq. G.1.
All Tables
Comparison of the mean spectral slope value in the visible range between S-complex inner main-belt families and (98943) Torifune.
All Figures
|
Fig. 1. Distribution of Torifune band parameter in the BI center versus BAR plan and BI versus BII. The red area, in the figure on the left, represents the region characterized by ordinary chondrites. |
| In the text | |
|
Fig. 2. Comparison between Torifune spectra and the meteorite L6 Chateau Renard from the RELAB database. |
| In the text | |
|
Fig. 3. Distribution of the visible spectral slope value according to the normalized rotational phase. Black points represent all the spectra taken in January 2023 while red points correspond to spectra taken in February 2023. |
| In the text | |
|
Fig. B.1. Visible spectra of (98943) Torifune taken in January (top) and February (bottom) 2023. |
| In the text | |
|
Fig. B.2. Comparison between color studies and spectra. In gray, spectra taken during the run of January 2023 (run #1), and, in red, spectra taken during the run of February 2023 (run #3). |
| In the text | |
|
Fig. E.1. Distribution of Torifune ratio of fayalite versus the ration of olivine and ratio of ferrosilite versus the ratio of olivine. Each square represents a type of ordinary chondrites. |
| In the text | |
Current usage metrics show cumulative count of Article Views (full-text article views including HTML views, PDF and ePub downloads, according to the available data) and Abstracts Views on Vision4Press platform.
Data correspond to usage on the plateform after 2015. The current usage metrics is available 48-96 hours after online publication and is updated daily on week days.
Initial download of the metrics may take a while.