Open Access
Fig. 3.
Download original image
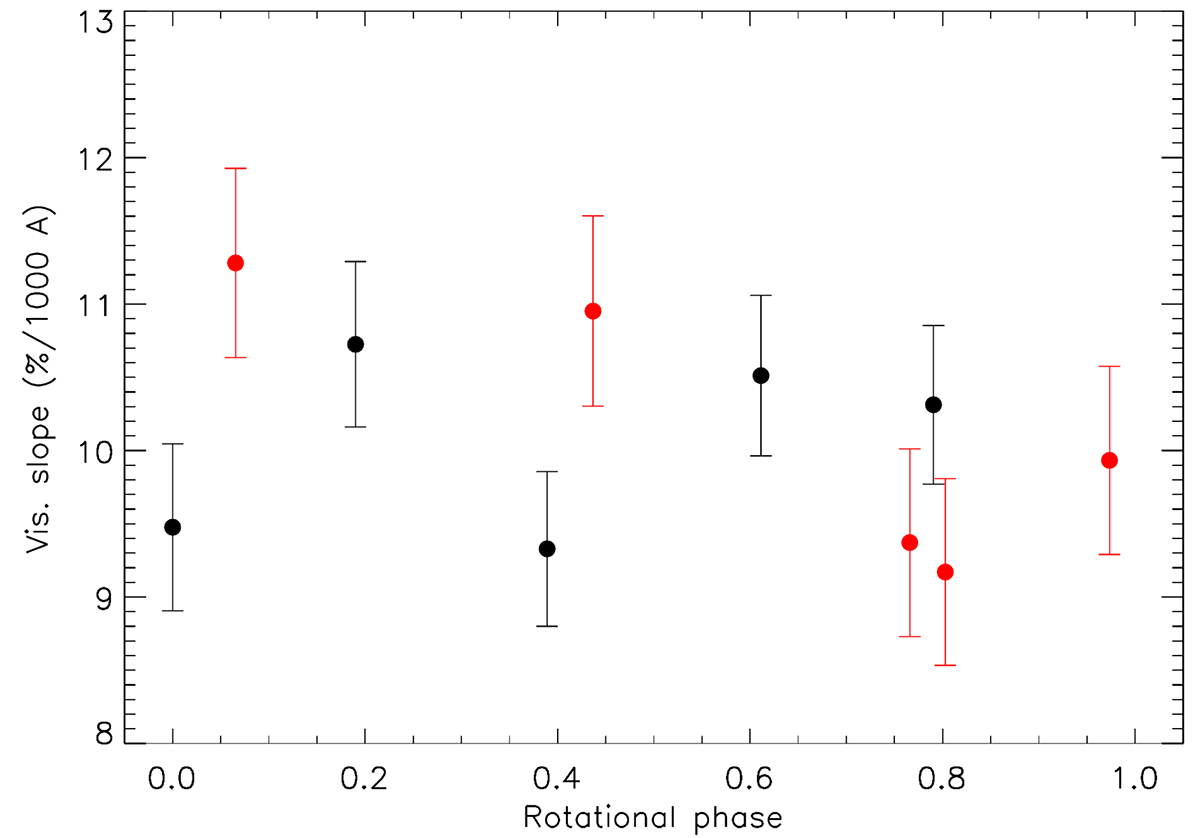
Distribution of the visible spectral slope value according to the normalized rotational phase. Black points represent all the spectra taken in January 2023 while red points correspond to spectra taken in February 2023.
Current usage metrics show cumulative count of Article Views (full-text article views including HTML views, PDF and ePub downloads, according to the available data) and Abstracts Views on Vision4Press platform.
Data correspond to usage on the plateform after 2015. The current usage metrics is available 48-96 hours after online publication and is updated daily on week days.
Initial download of the metrics may take a while.