Fig. 7
Download original image
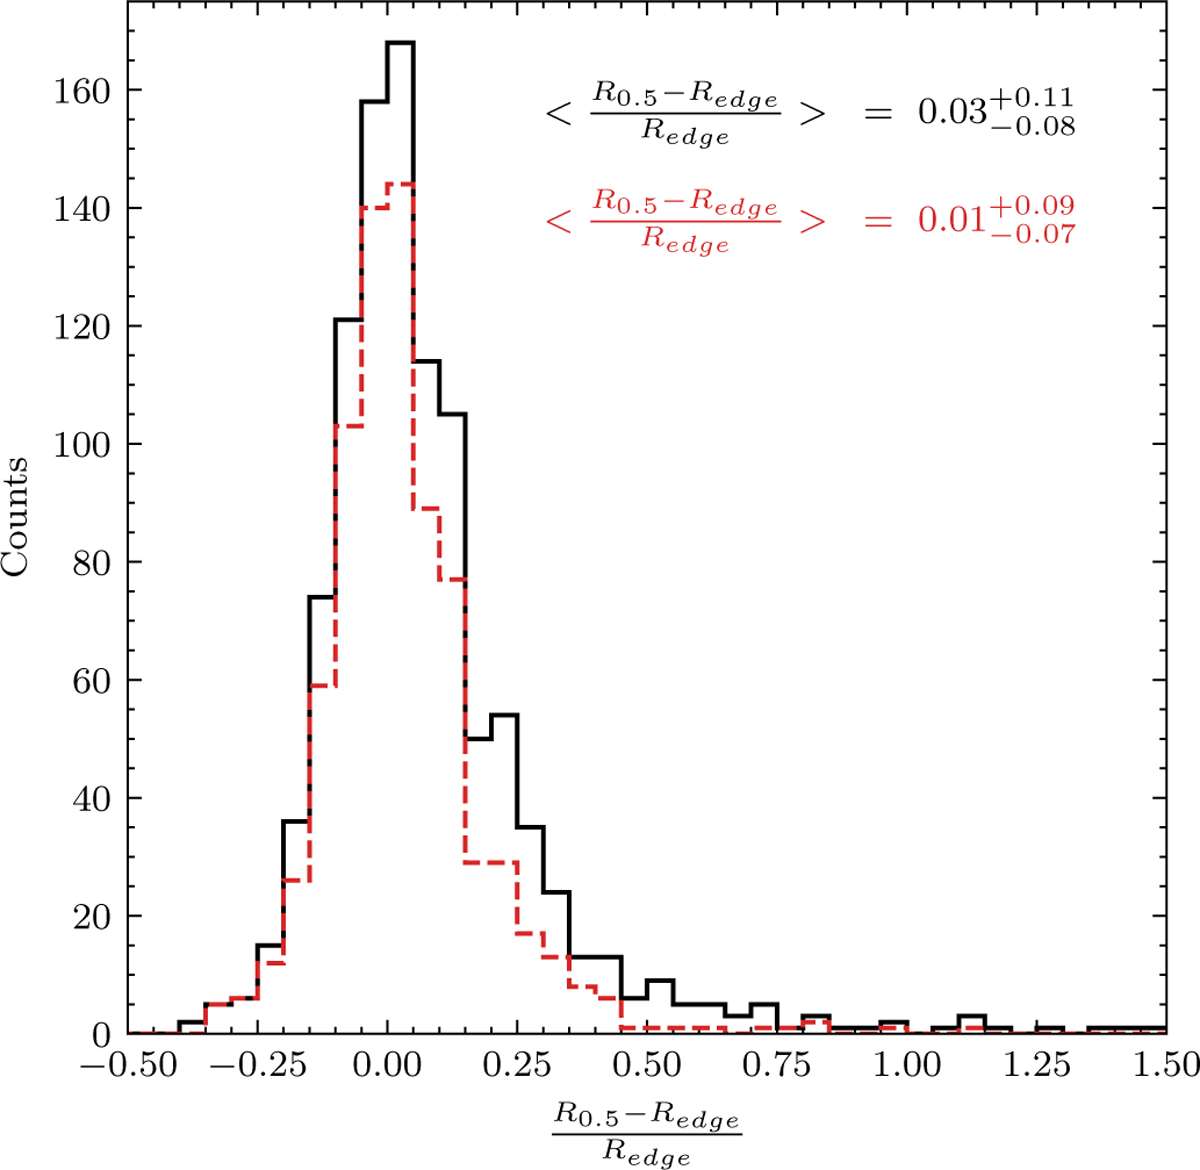
Distributions of the relative error between the size of the galaxy measured from the SAM truncation (denoted as R0.5) and the semimajor axis of the truncation ellipse in BT24 (denoted as Redge). The solid black histogram corresponds to the whole sample of 1047 galaxies, while the dashed red histogram shows the distribution for 774 galaxies with ΔR0.5 ≲ 0.17 (i.e., excluding those within the Q5 quintile) and b/a > 0.25. The median and IQR of the relative error between the two estimates for both distributions are also shown.
Current usage metrics show cumulative count of Article Views (full-text article views including HTML views, PDF and ePub downloads, according to the available data) and Abstracts Views on Vision4Press platform.
Data correspond to usage on the plateform after 2015. The current usage metrics is available 48-96 hours after online publication and is updated daily on week days.
Initial download of the metrics may take a while.