Fig. 4
Download original image
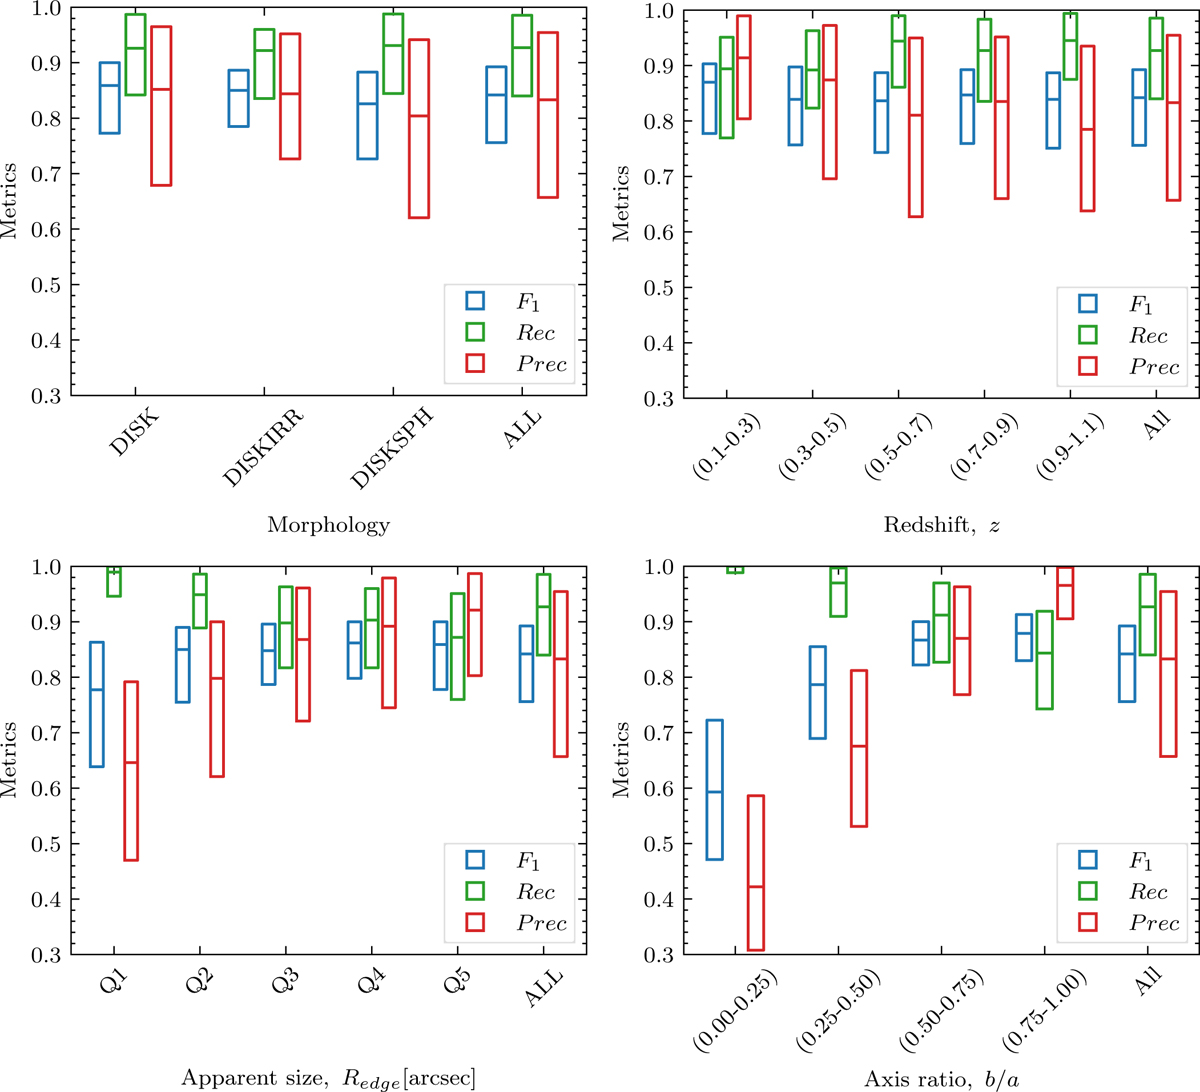
From left to right, SAM’s performance as a function of: morphological type, redshift, apparent size (Redge , semi-major axis of the BT24 truncation) split in quintiles, and axis ratio of the BT24 truncation. Metrics are shown in different colors: F1 in blue, Rec in green, and Prec in red. Boxes represent the IQR, while the horizontal lines indicate the median value. F1 and Prec values decrease, while keeping high Rec values, for small and/or elongated galaxies.
Current usage metrics show cumulative count of Article Views (full-text article views including HTML views, PDF and ePub downloads, according to the available data) and Abstracts Views on Vision4Press platform.
Data correspond to usage on the plateform after 2015. The current usage metrics is available 48-96 hours after online publication and is updated daily on week days.
Initial download of the metrics may take a while.