Fig. 3
Download original image
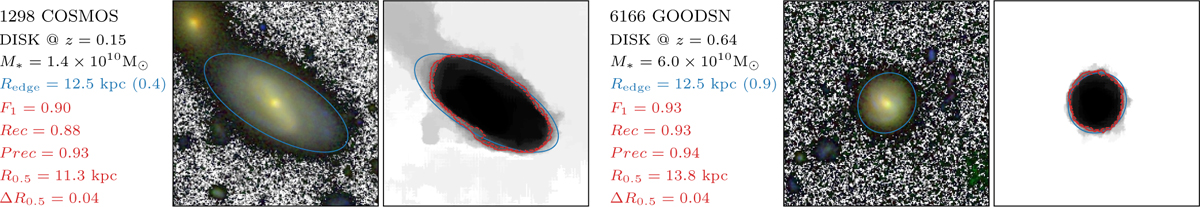
SAM truncations for two example galaxies: ID = 1298 in the COSMOS field (left-hand panel) and ID = 6166 in the GOODSN field (right-hand panel). For each galaxy, we show an RGB image (left-hand panel) of the galaxy and the averaged segmentation map inferred with SAM (right-hand panel). The averaged segmentation map shows the SAM truncations (in gray) for different configurations of the input image, where darker regions indicate stronger agreement between different truncation estimates. The solid red contours depict the SAM truncation based on the majority voting criteria (above a 0.5 threshold), while the dashed red contours correspond to the regions above a 0.7 probability threshold. The blue ellipse corresponds to the truncation derived by BT24 parameterized by the semi-major axis (denoted as Redge) and the axis ratio, b/a (shown between brackets after the Redge value). We indicate in red the different metrics (F1, Rec, and Prec) when comparing the SAM and the BT24 truncation estimates, the size of the truncation (R0.5), and the relative error in the size of the truncation and the contour level at a 0.7 probability, denoted as ∆R0.5.
Current usage metrics show cumulative count of Article Views (full-text article views including HTML views, PDF and ePub downloads, according to the available data) and Abstracts Views on Vision4Press platform.
Data correspond to usage on the plateform after 2015. The current usage metrics is available 48-96 hours after online publication and is updated daily on week days.
Initial download of the metrics may take a while.