Fig. 2
Download original image
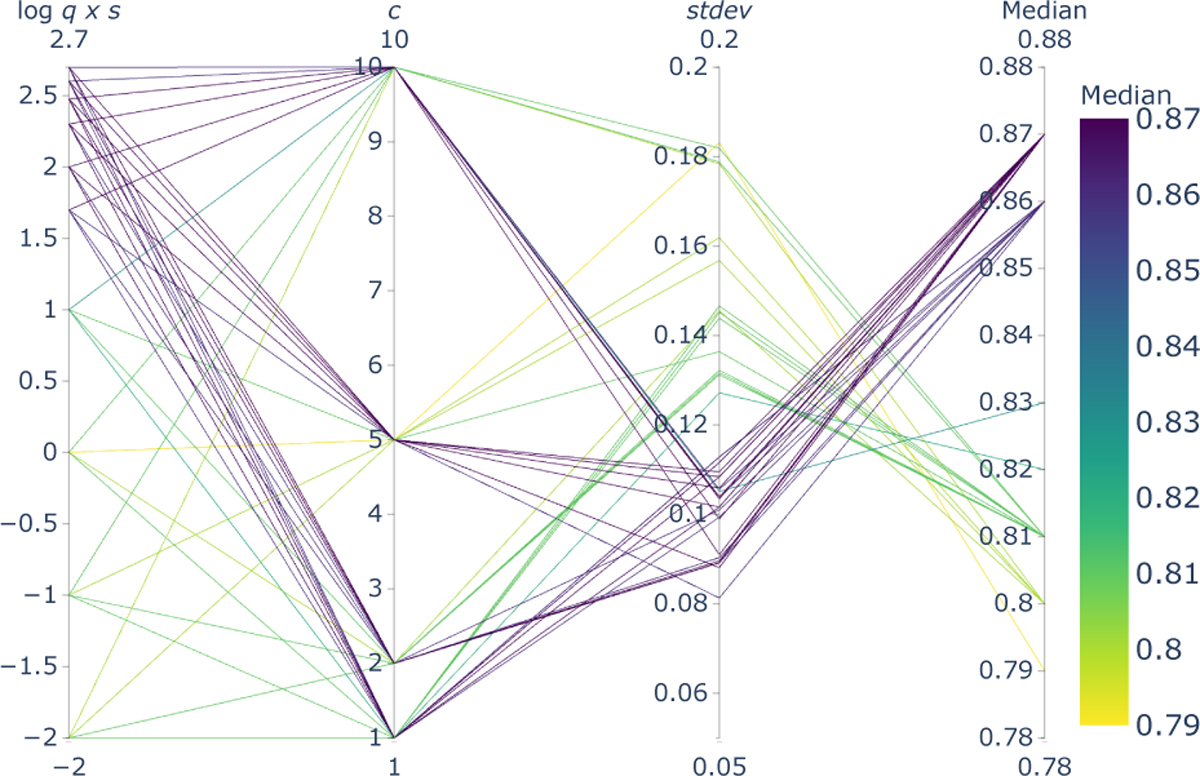
Parallel coordinates plot for the 40 input configurations combining q × s (in log scale, first coordinate), c (second coordinate), standard deviation of the F1 score (third coordinate), and median values of the F1 score (fourth coordinate). Each configuration is color-coded according to the median F1 score. All the configurations with log(q × s) ≳ 1.7 (q × s ≥ 50) (independently of the contrast value, c) lead to the largest median values of the F1 score with the smallest values of the standard deviation of the F1 score.
Current usage metrics show cumulative count of Article Views (full-text article views including HTML views, PDF and ePub downloads, according to the available data) and Abstracts Views on Vision4Press platform.
Data correspond to usage on the plateform after 2015. The current usage metrics is available 48-96 hours after online publication and is updated daily on week days.
Initial download of the metrics may take a while.