Open Access
Fig. 7.
Download original image
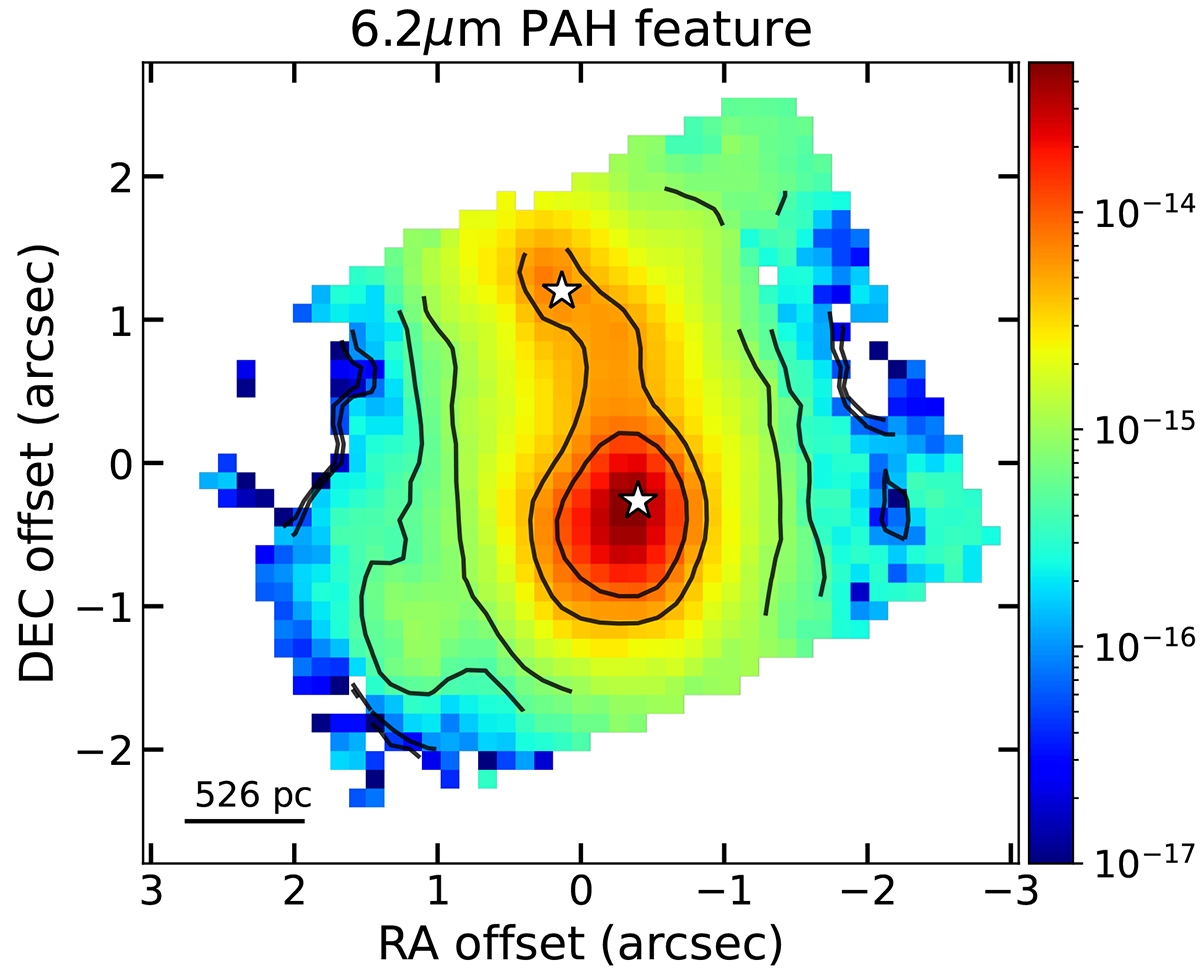
Flux map of the PAH feature at 6.2 μm in log scale estimated after subtracting a local continuum from both sides of the feature. The contour levels go from 10−16 to 10−14 erg s−1 cm−2.
Current usage metrics show cumulative count of Article Views (full-text article views including HTML views, PDF and ePub downloads, according to the available data) and Abstracts Views on Vision4Press platform.
Data correspond to usage on the plateform after 2015. The current usage metrics is available 48-96 hours after online publication and is updated daily on week days.
Initial download of the metrics may take a while.