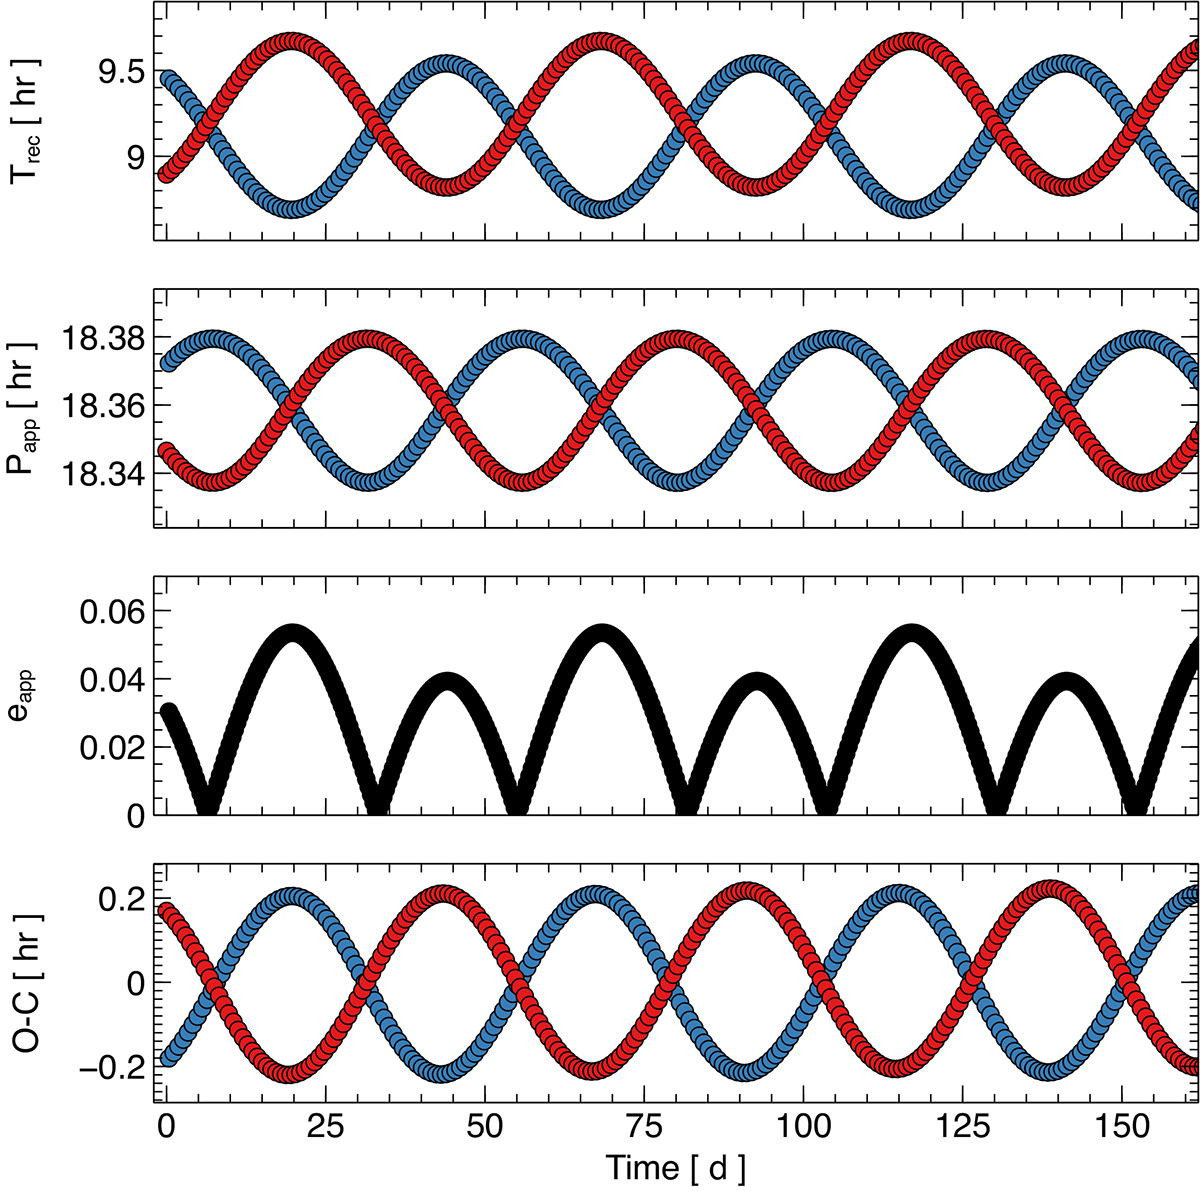
Fig. 7.
Download original image
QPE timing from the impact model. We show Trec, Papp, eapp, and the O–C diagrams for a nearly circular EMRI orbit with eccentricity e = 0.05, and parameters commensurate with those of GSN 069. Odd and even QPEs are shown in red and blue respectively. We point out that the data points in the lower panels (O–C diagrams) are not exactly aligned with those in the upper ones. This is because the abscissa of a given data point in O–C diagrams is a multiple of Ptrial rather than the observed QPE arrival time.
Current usage metrics show cumulative count of Article Views (full-text article views including HTML views, PDF and ePub downloads, according to the available data) and Abstracts Views on Vision4Press platform.
Data correspond to usage on the plateform after 2015. The current usage metrics is available 48-96 hours after online publication and is updated daily on week days.
Initial download of the metrics may take a while.