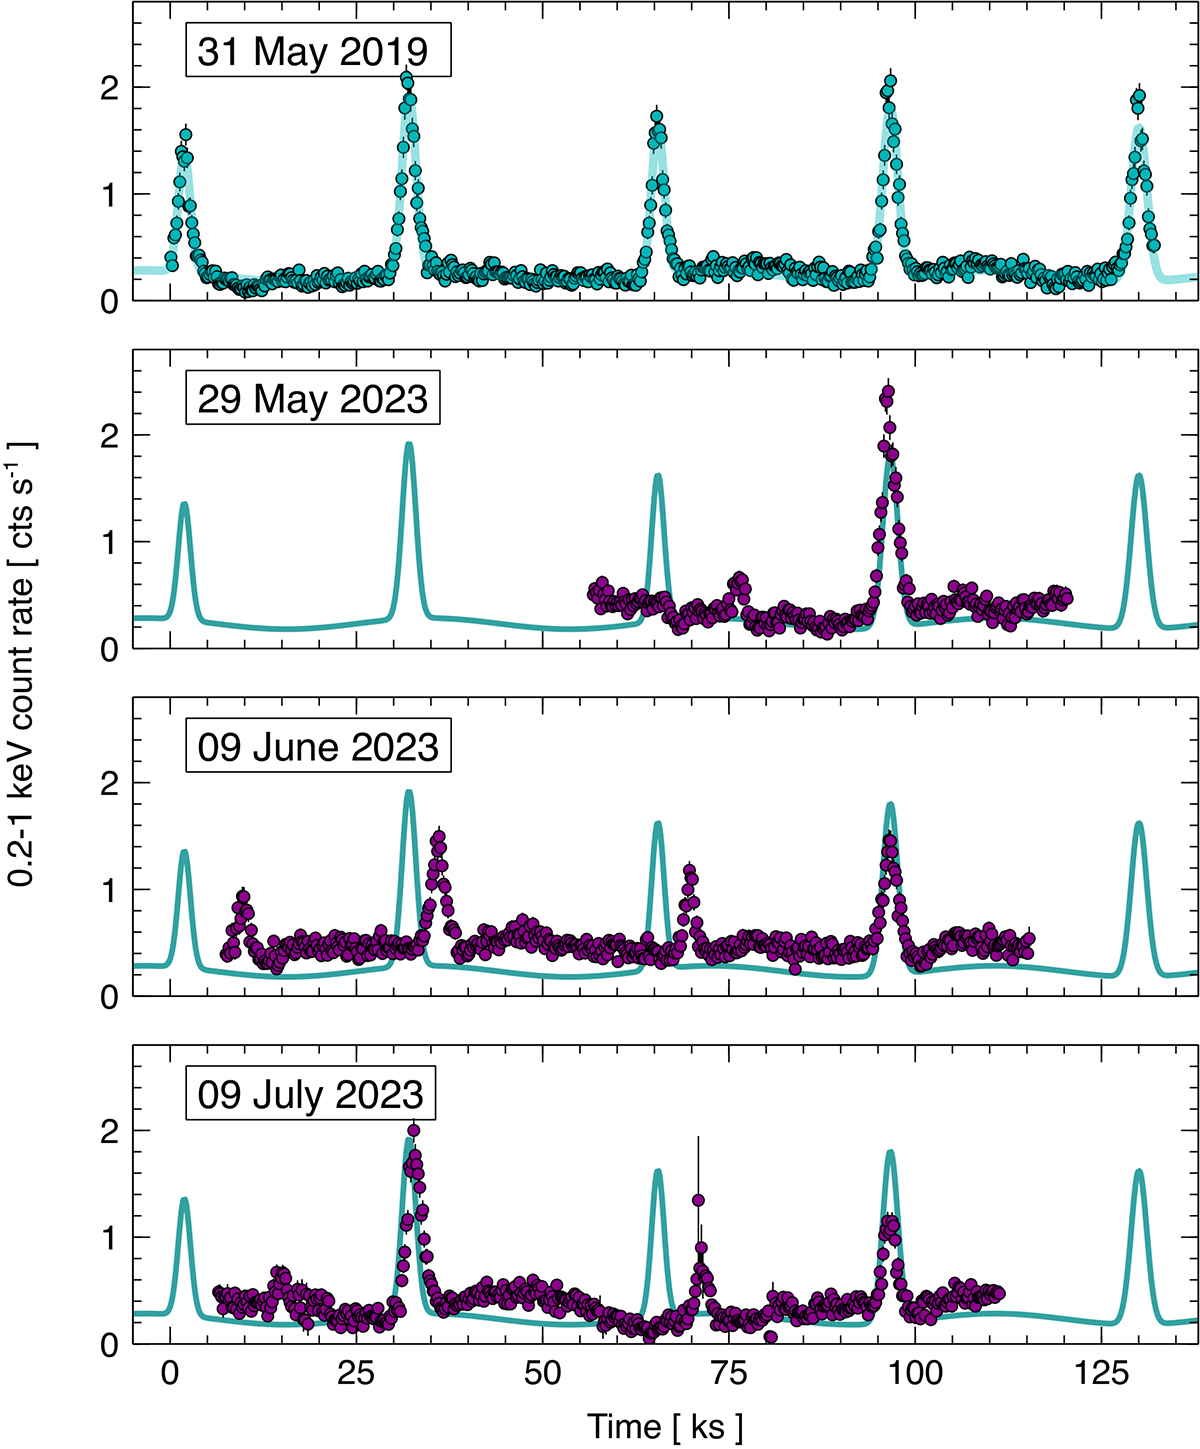
Fig. 6.
Download original image
2023 campaign on GSN 069. In the upper panel, we show the XMM-Newton EPIC-pn light curve from the May 2019 observation, together with a representative best-fitting model. The EPIC-pn light curves from the 2023 campaign are shown in the lower panels. We aligned the last QPEs of these latter observations with one of the QPEs in the upper panel to ease comparison, and we also reproduced the best-fitting model for the May 2019 light curve in the lower panels.
Current usage metrics show cumulative count of Article Views (full-text article views including HTML views, PDF and ePub downloads, according to the available data) and Abstracts Views on Vision4Press platform.
Data correspond to usage on the plateform after 2015. The current usage metrics is available 48-96 hours after online publication and is updated daily on week days.
Initial download of the metrics may take a while.