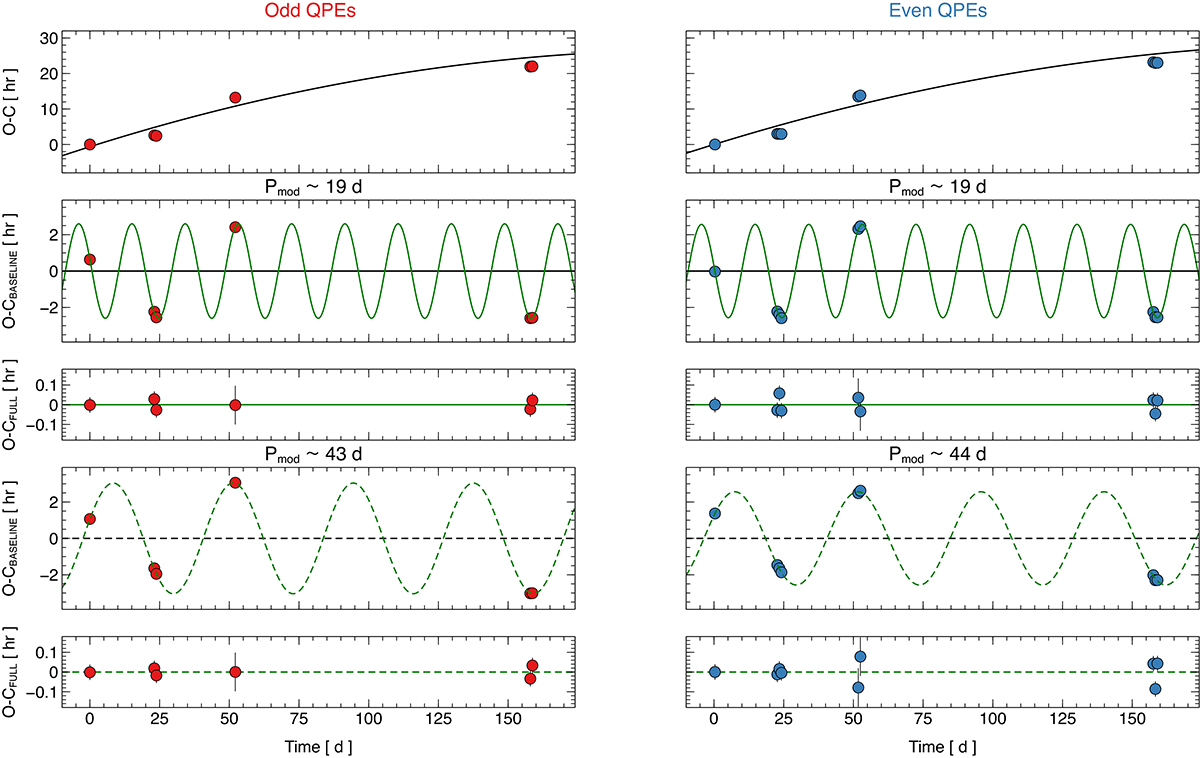
Fig. 4.
Download original image
O–C diagrams for GSN 069. We show the O–C diagrams for odd (left) and even (right) QPEs for GSN 069 resulting from identifying the first QPE of the May 2019 observation with the 211th even QPE. The upper panels show the O–C data together with the linear plus parabolic baseline model for Pmod ≃ 19 d. The lower panels show the corresponding residuals (O–CBASELINE) as well as the ones corresponding to the full best-fitting model including a sinusoidal modulation (O–CFULL) for the two possible Pmod. The sinusoidal modulation is also shown in the O–CBASELINE to guide the eye.
Current usage metrics show cumulative count of Article Views (full-text article views including HTML views, PDF and ePub downloads, according to the available data) and Abstracts Views on Vision4Press platform.
Data correspond to usage on the plateform after 2015. The current usage metrics is available 48-96 hours after online publication and is updated daily on week days.
Initial download of the metrics may take a while.