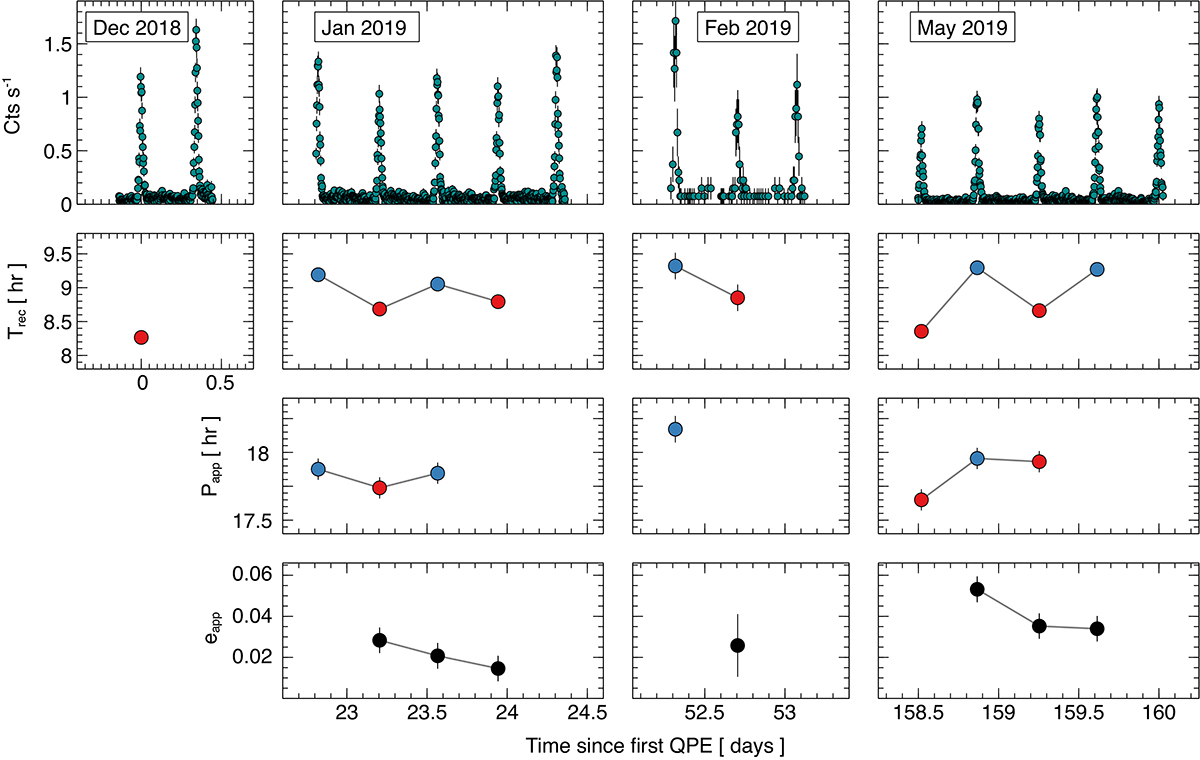
Fig. 3.

Download original image
QPE timing properties in GSN 069. In the upper row, we show the X-ray 0.4–1 keV light curves of GSN 069 used in this work. The first two and last light curves are from the EPIC-pn camera on board XMM-Newton, while the third is from the ACIS-S detector on board Chandra. The latter light curve has been re-scaled to the expected EPIC-pn count rate (as in Miniutti et al. 2023a). XMM-Newton data could be used down to 0.2 keV but, since QPE properties (peak time and overall duration) are energy-dependent (Miniutti et al. 2019), we use here a common energy band down to 0.4 keV only in order to make use also of the Chandra data. The three lower rows show Trec, Papp, and eapp as obtained from the QPE peak times. Due to the gaps in the data the colour code distinguishing odd from even QPEs during different observations might be different from the one shown here where we arbitrarily assigned all stronger (weaker) QPEs to the even (odd) time series.
Current usage metrics show cumulative count of Article Views (full-text article views including HTML views, PDF and ePub downloads, according to the available data) and Abstracts Views on Vision4Press platform.
Data correspond to usage on the plateform after 2015. The current usage metrics is available 48-96 hours after online publication and is updated daily on week days.
Initial download of the metrics may take a while.


