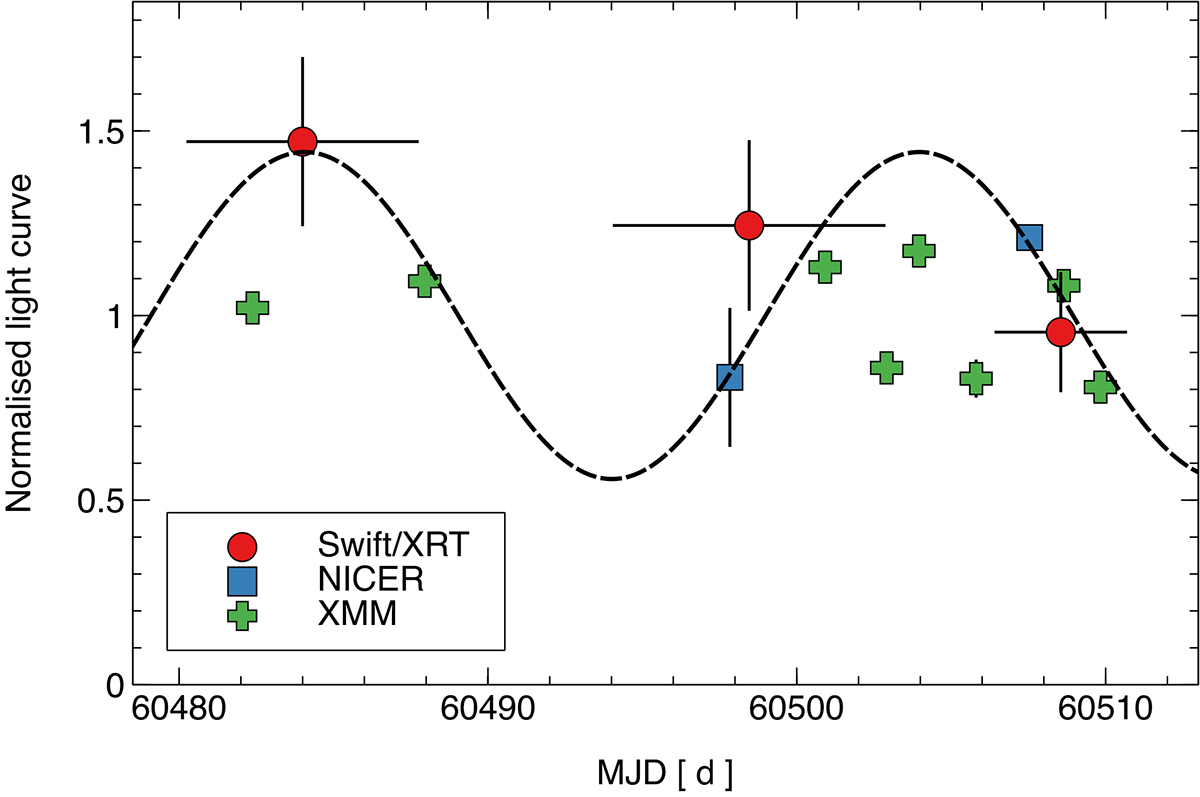
Fig. 12.
Download original image
Zoom of Fig. 10 over a restricted MJD range in which eight XMM-Newton observations are also available (green crosses). The XMM-Newton data points show the 0.3–1 keV average X-ray flux during each XMM-Newton observation, normalised to the best-fitting constant model over the spanned baseline. Uncertainties on the XMM-Newton data are included, but smaller than symbol size.
Current usage metrics show cumulative count of Article Views (full-text article views including HTML views, PDF and ePub downloads, according to the available data) and Abstracts Views on Vision4Press platform.
Data correspond to usage on the plateform after 2015. The current usage metrics is available 48-96 hours after online publication and is updated daily on week days.
Initial download of the metrics may take a while.