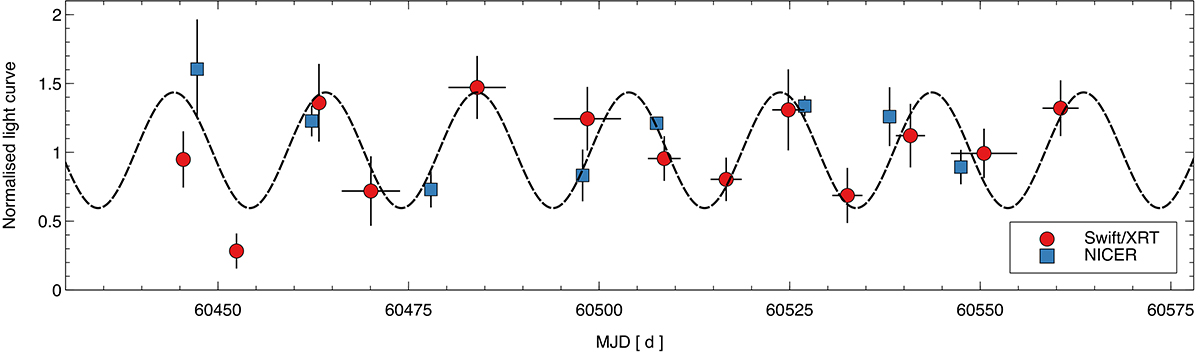
Fig. 10.
Download original image
2024 Swift and NICER monitoring campaign. We show the normalised 0.3–1 keV quiescent light curves of GSN 069 as obtained by the Swift XRT and by NICER during the current campaign. Any two consecutive Swift observations with consistent count rates have been combined to reduce the statistical uncertainty. Individual NICER snapshots have been analysed separately, and the data points represent the mean 0.3–1 keV flux and standard deviation obtained within a few hours. The dashed line is a sine function modulation with period ≃19.9 d and semi-amplitude ≃45% resulting in χ2 = 31 for 17 degrees of freedom.
Current usage metrics show cumulative count of Article Views (full-text article views including HTML views, PDF and ePub downloads, according to the available data) and Abstracts Views on Vision4Press platform.
Data correspond to usage on the plateform after 2015. The current usage metrics is available 48-96 hours after online publication and is updated daily on week days.
Initial download of the metrics may take a while.