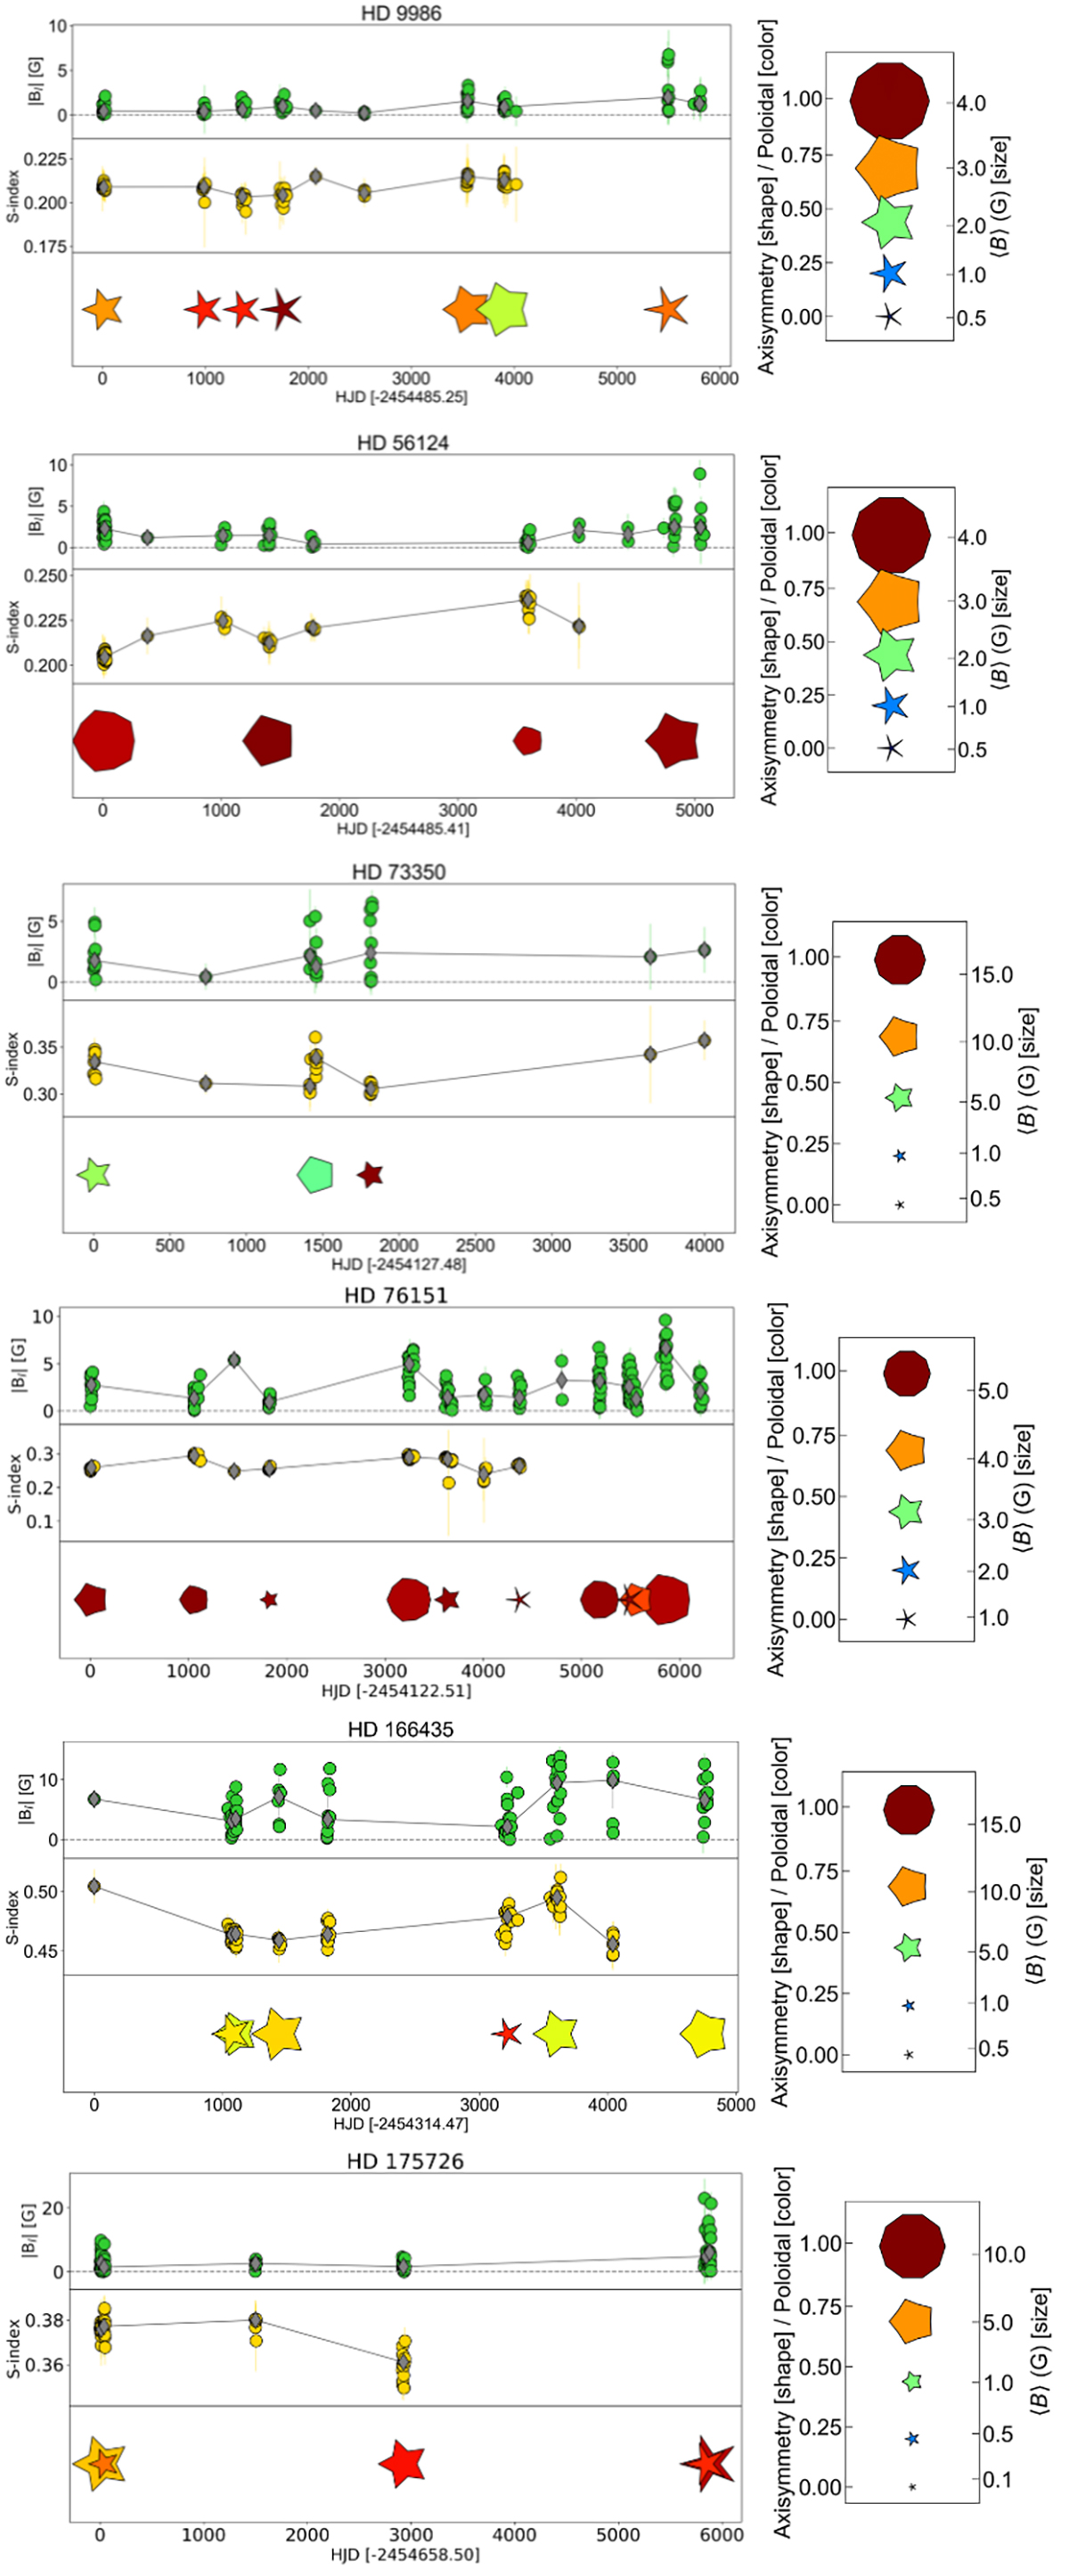
Fig. 10.
Download original image
Long-term evolution of activity indices and large-scale magnetic field topology for all our stars. Each panel corresponds to a star and contains the time series of |Bl| (top), S-index (middle) and large-scale topology reconstructed with ZDI (bottom). In the |Bl| and S-index panels, the epoch-averaged values are shown as grey diamonds, and they are connected by a solid grey line. In the topology panels, the symbol size, colour, and shape encode the ZDI average field strength, poloidal or toroidal energy fraction, and axisymmetry, respectively, as is illustrated in the side bar.
Current usage metrics show cumulative count of Article Views (full-text article views including HTML views, PDF and ePub downloads, according to the available data) and Abstracts Views on Vision4Press platform.
Data correspond to usage on the plateform after 2015. The current usage metrics is available 48-96 hours after online publication and is updated daily on week days.
Initial download of the metrics may take a while.