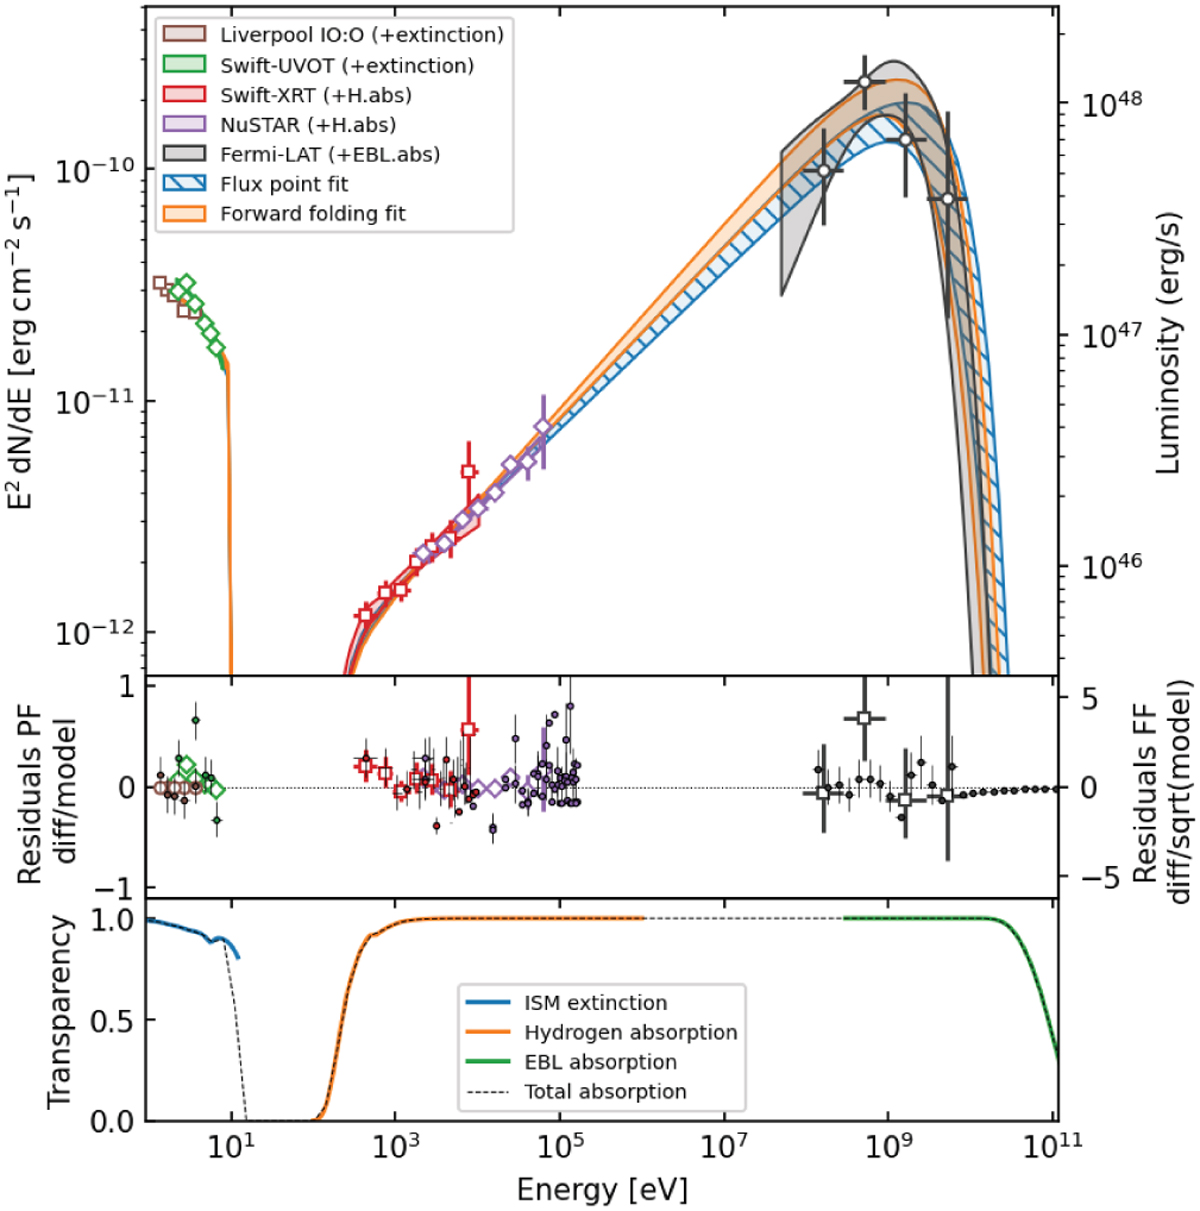
Fig. 9
Download original image
Joint multi-instrument forward-folding fit and joint fit using fluxpoints employing a phenomenological model with two distinct emission components and three absorption components. Top panel: individual datasets fitted with simple models (power-laws, log-parabolas, powerlaws with exponential cutoffs) and corresponding reconstructed flux points, and joint fits (flux points, forward folding). Middle panel: residuals, calculated as the ratio of reconstructed differential spectrum to model prediction for the flux points fit (residual PF, open markers), and as the significance or ratio of the difference between the excess counts and model predicted counts to the square root of the model predictions for each bin in the forward folding case (Residuals FF, small filled circles). For clarity, and due to the large amount of energy bins in the X-ray datasets, only one every five bins is shown for NuSTAR and one every three bins is shown for XRT. Bottom panel: multiplicative absorption components.
Current usage metrics show cumulative count of Article Views (full-text article views including HTML views, PDF and ePub downloads, according to the available data) and Abstracts Views on Vision4Press platform.
Data correspond to usage on the plateform after 2015. The current usage metrics is available 48-96 hours after online publication and is updated daily on week days.
Initial download of the metrics may take a while.