Fig. 7
Download original image
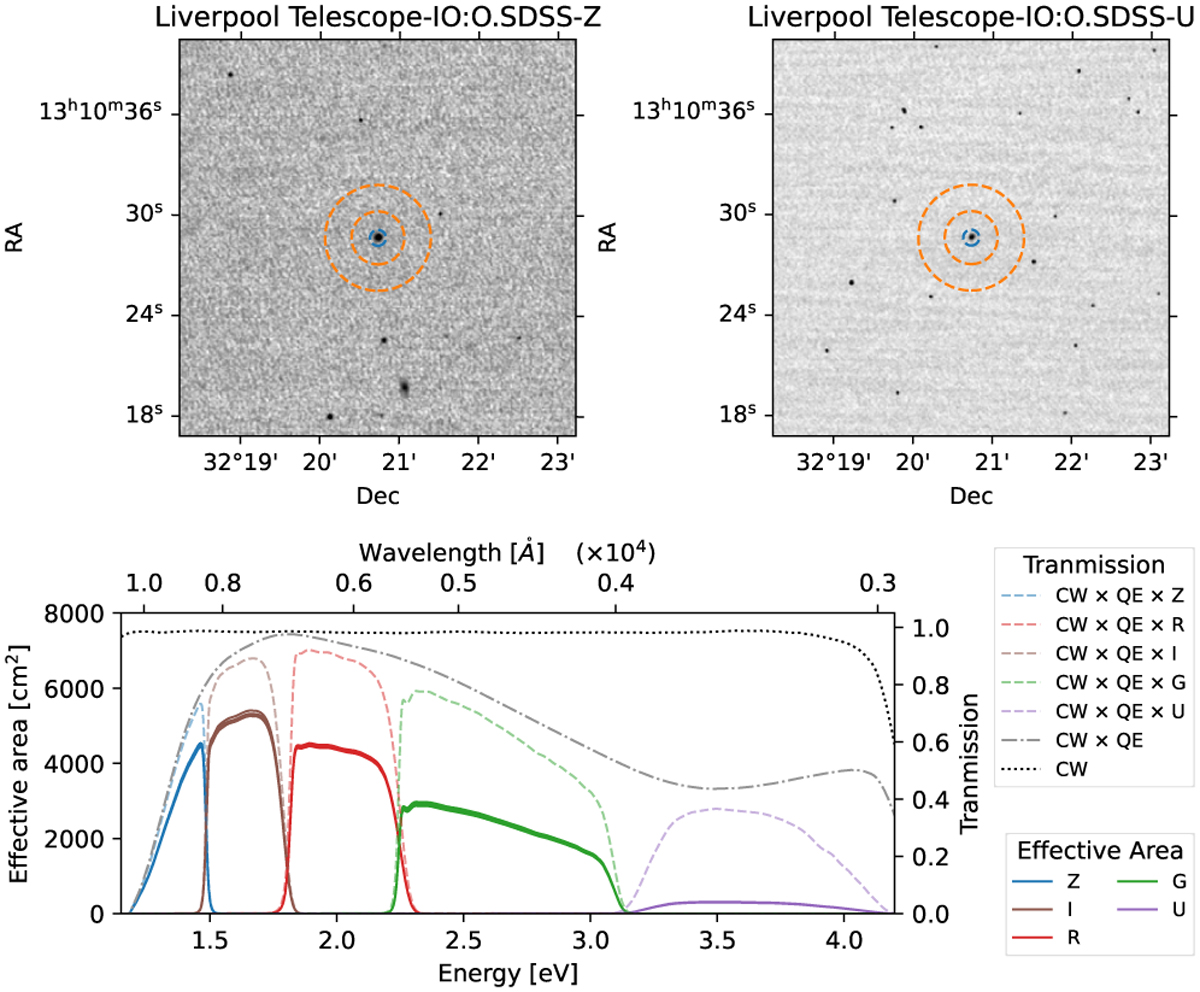
Liverpool IO:O dataset representation. Top row: LT IO:O images in two of the photometric filters available for the first selected night, with the signal and background extraction regions represented by blue and orange dashed circles and annuli, respectively. Bottom row: throughput for each of the available LT IO:O bands (transmission of the filter multiplied by the cryostat window transmission, CW, and the quantum efficiency of the CCD, QE) as dashed curves, and for CW and CW×QE alone. For completeness, the reconstructed effective area for each calibration star and each filter are shown as solid colored curves.
Current usage metrics show cumulative count of Article Views (full-text article views including HTML views, PDF and ePub downloads, according to the available data) and Abstracts Views on Vision4Press platform.
Data correspond to usage on the plateform after 2015. The current usage metrics is available 48-96 hours after online publication and is updated daily on week days.
Initial download of the metrics may take a while.