Fig. 5
Download original image
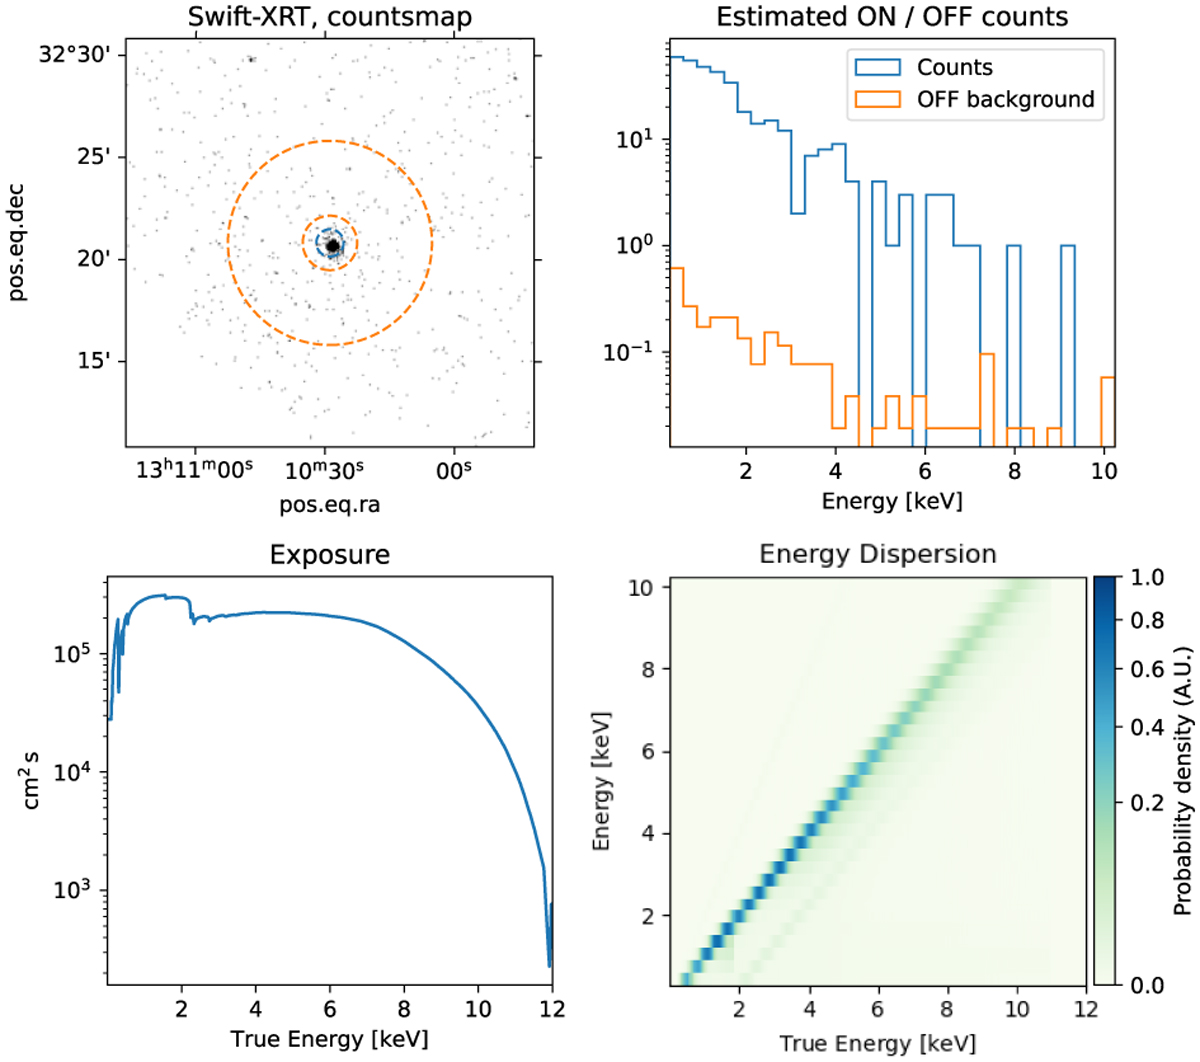
Swift-XRT dataset representation after energy bin grouping to avoid background spectra dominated by zeros. (a) Swift-XRT image of OP 313. Blue circle and orange annulus show the signal and background extraction regions, respectively. (b) Distribution of events for both regions as a function of energy, corrected for the different region sizes. (c) Swift-XRT exposure (effective area × livetime) as a function of true energy. (d) Swift-XRT energy dispersion matrix (also known as redistribution matrix or migration matrix).
Current usage metrics show cumulative count of Article Views (full-text article views including HTML views, PDF and ePub downloads, according to the available data) and Abstracts Views on Vision4Press platform.
Data correspond to usage on the plateform after 2015. The current usage metrics is available 48-96 hours after online publication and is updated daily on week days.
Initial download of the metrics may take a while.