Fig. 4
Download original image
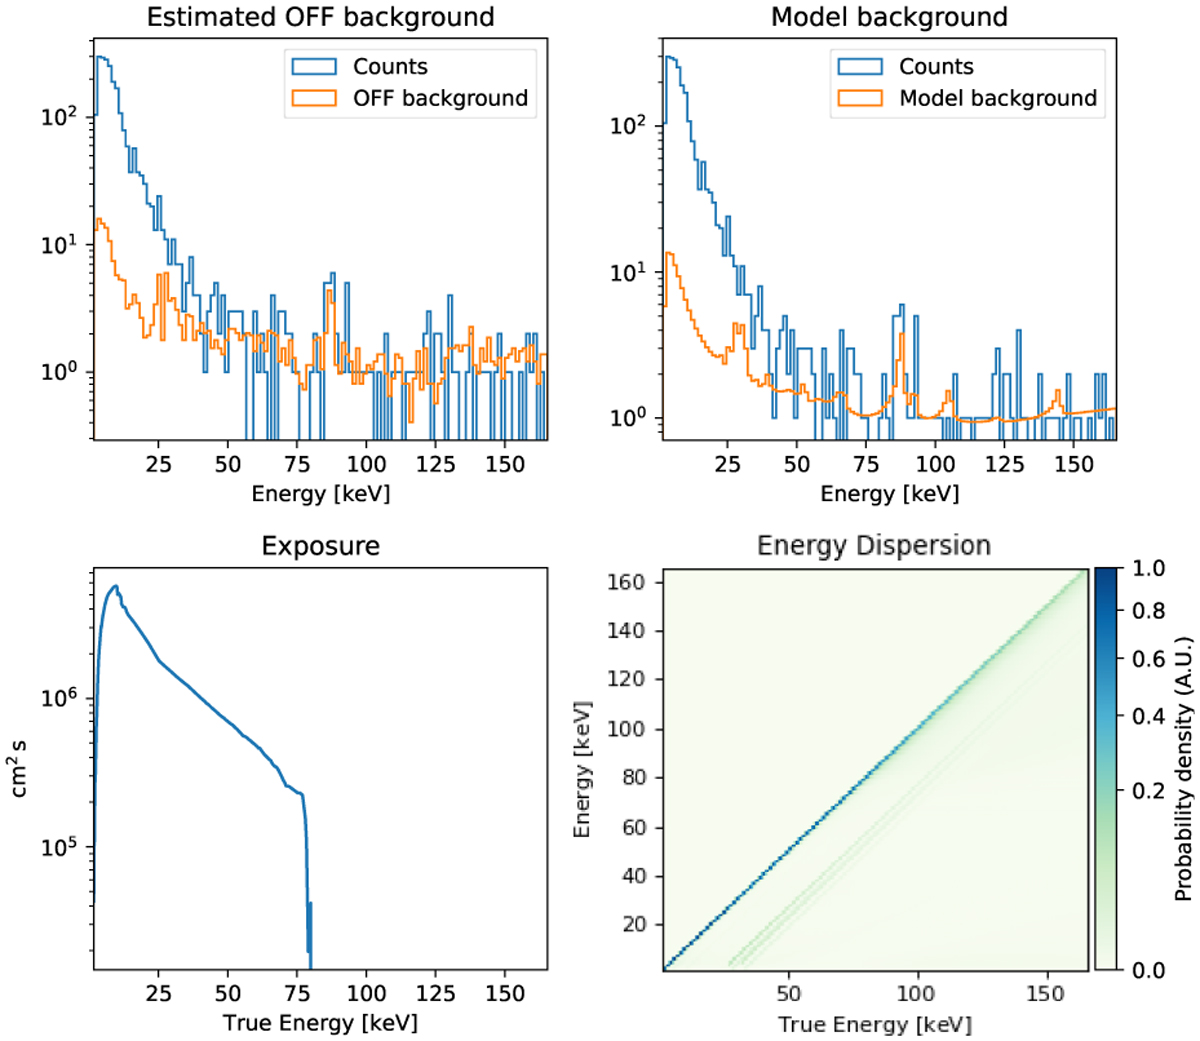
gammapy dataset representation of NuSTAR A for night 1 is shown here. NuSTAR B for this observation and NuSTAR A/B for night 2 are similar. From top-left to bottom-right: (a) estimated distribution of background events from the OFF rectangular region of Fig. 3 and the ON event distribution from the signal extraction region. (b) Estimated distribution of background events from nuskybgd. ON event distribution identical to the previous case. (c) NuSTAR A exposure (effective area × livetime) as a function of true energy. (d) NuSTAR A energy dispersion matrix.
Current usage metrics show cumulative count of Article Views (full-text article views including HTML views, PDF and ePub downloads, according to the available data) and Abstracts Views on Vision4Press platform.
Data correspond to usage on the plateform after 2015. The current usage metrics is available 48-96 hours after online publication and is updated daily on week days.
Initial download of the metrics may take a while.