Fig. C.4
Download original image
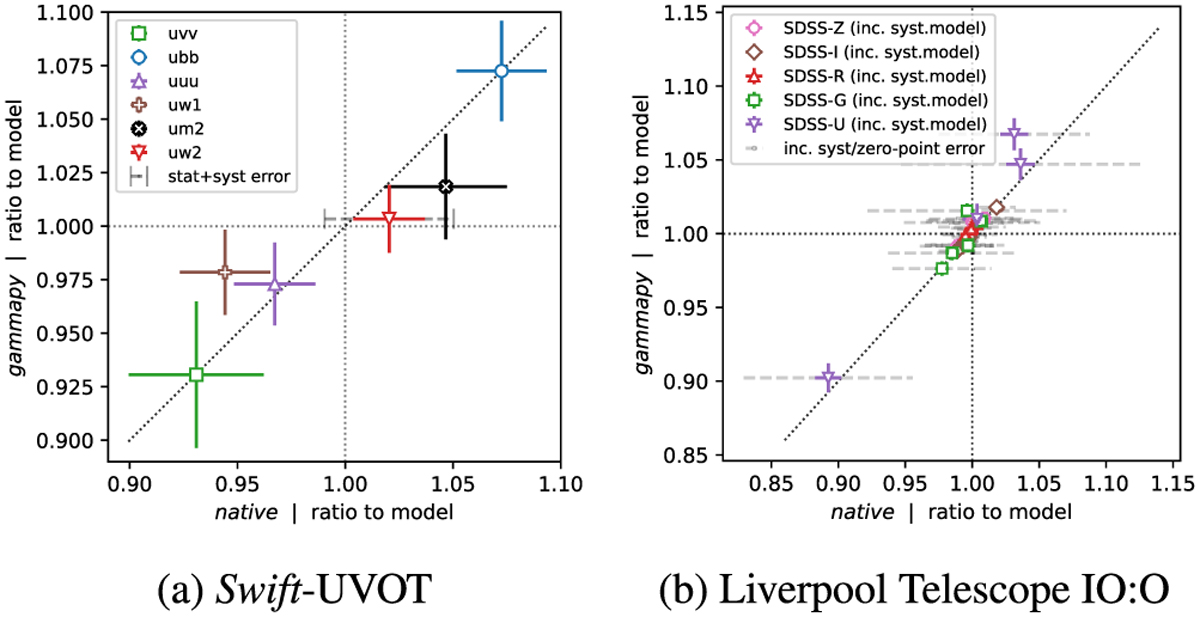
Comparison of reconstructed ‘relative’ flux values using native photometry tools (reconstructed flux densities multiplied by the filter’s effective frequency) and those obtained with gammapy (using counts and instrument response functions). All ‘relative’ fluxes are shown as a ratio to the best-fit gammapy model of the joint datasets, evaluated at the corresponding point energy.
Current usage metrics show cumulative count of Article Views (full-text article views including HTML views, PDF and ePub downloads, according to the available data) and Abstracts Views on Vision4Press platform.
Data correspond to usage on the plateform after 2015. The current usage metrics is available 48-96 hours after online publication and is updated daily on week days.
Initial download of the metrics may take a while.