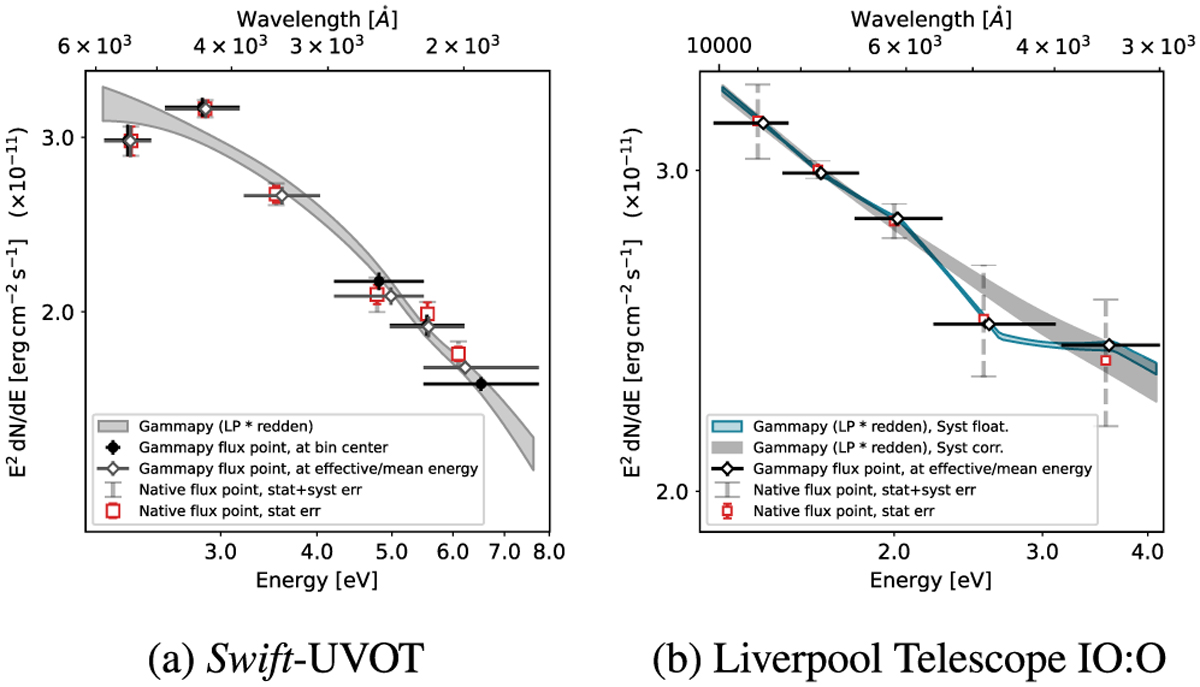
Fig. C.3
Download original image
Best-fit spectra (log-parabola with dust extinction) and flux points reconstructed using gammapy – based on counts and IRFs – and with native tools using flux densities multiplied by the effective filter frequency center. Flux points in gammapy are evaluated over the geometrical center of the bin (black filled circles) and at the effective mean energy of the band with open diamond symbols (under the assumption of a flat source photon spectrum, to be roughly comparable to the classical method). LT datasets from the same filter were stacked together using gammapy’s stack_reduce method, that co-adds the counts, background and exposures for datasets with compatible energy axes. For the native analysis, weighted averages are shown instead as red boxes. Dashed gray error bars depict the total error once incorporating systematic uncertainties.
Current usage metrics show cumulative count of Article Views (full-text article views including HTML views, PDF and ePub downloads, according to the available data) and Abstracts Views on Vision4Press platform.
Data correspond to usage on the plateform after 2015. The current usage metrics is available 48-96 hours after online publication and is updated daily on week days.
Initial download of the metrics may take a while.