Fig. C.2
Download original image
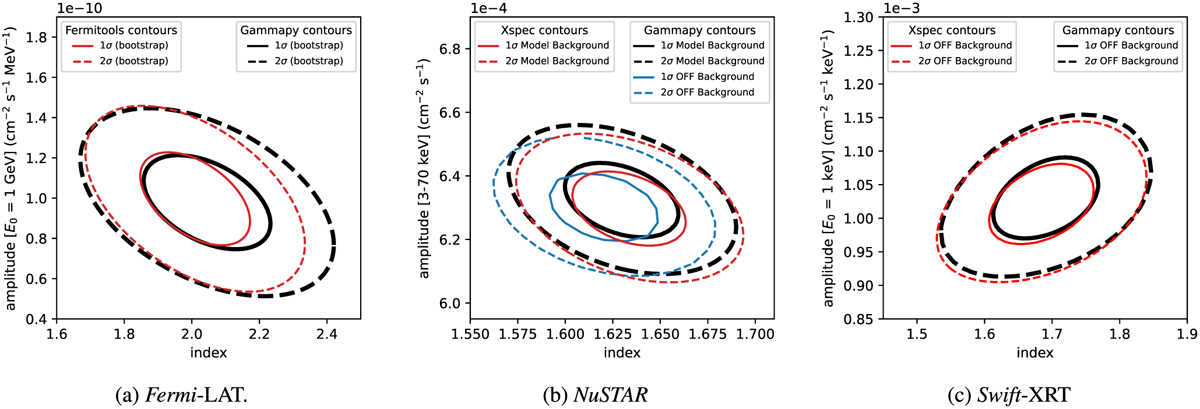
Parameter error ellipses on the amplitude (integral flux for NuSTAR) and spectral index for the power-law fit to the Fermi-LAT, NuSTAR A+B and Swift-XRT datasets. Contours in black correspond to gammapy, while the native tool contours are shown in red. For NuSTAR, the contours obtained with the Poisson or OFF background estimate are shown in blue for reference.
Current usage metrics show cumulative count of Article Views (full-text article views including HTML views, PDF and ePub downloads, according to the available data) and Abstracts Views on Vision4Press platform.
Data correspond to usage on the plateform after 2015. The current usage metrics is available 48-96 hours after online publication and is updated daily on week days.
Initial download of the metrics may take a while.