Fig. 1
Download original image
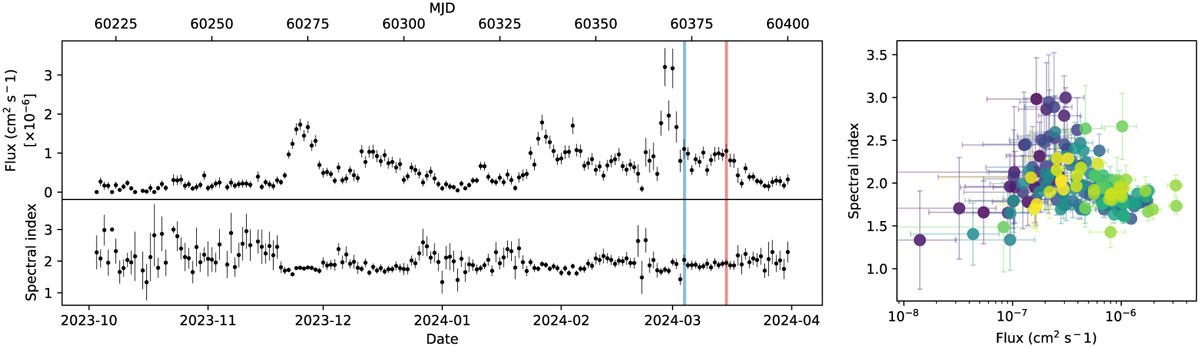
Long term evolution of the nightly high-energy gamma-ray flux emitted by OP 313. Left: Fermi-LAT light curve (1-day binning) of OP 313 above 100 MeV during the major 2023–2024 flare episode, for integral flux and spectral index. Blue and red bars mark the two nights with NuSTAR observations that are the focus of this study. Right: spectral index as a function of the integral flux for each night over six months of LAT data. The density of points is color-coded, with yellow points showing larger number density of nights and purple-blue tones indicating more isolated bins.
Current usage metrics show cumulative count of Article Views (full-text article views including HTML views, PDF and ePub downloads, according to the available data) and Abstracts Views on Vision4Press platform.
Data correspond to usage on the plateform after 2015. The current usage metrics is available 48-96 hours after online publication and is updated daily on week days.
Initial download of the metrics may take a while.