Fig. B.1.
Download original image
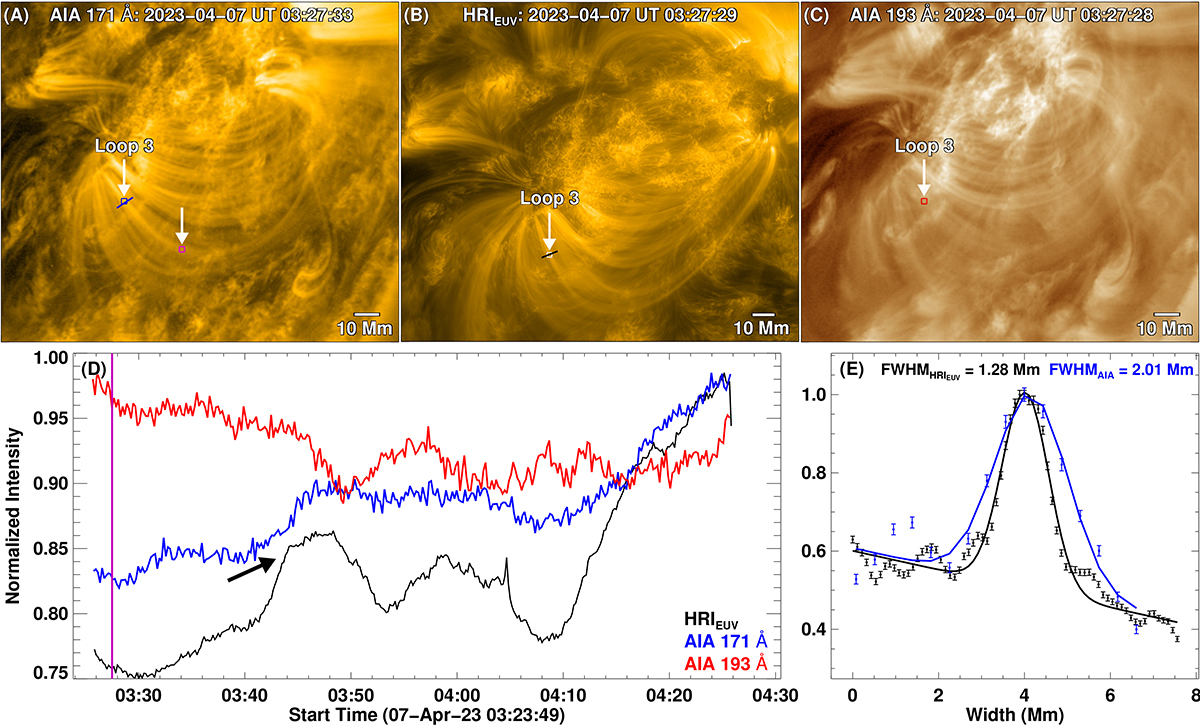
Evolution of loop 3. The panel layout, color, and size of the boxes for the light curves, and the slit widths are similar to those in Fig. 2. The average intensity within the 5 × 5 pixel magenta box in panel (A) is used to derive the correspondingly colored light curve in panel (B) of Fig. 5. The black arrow points to the intensity enhancement in the HRIEUV light curve. An animation of panels (A)-(D) is available online.
Current usage metrics show cumulative count of Article Views (full-text article views including HTML views, PDF and ePub downloads, according to the available data) and Abstracts Views on Vision4Press platform.
Data correspond to usage on the plateform after 2015. The current usage metrics is available 48-96 hours after online publication and is updated daily on week days.
Initial download of the metrics may take a while.