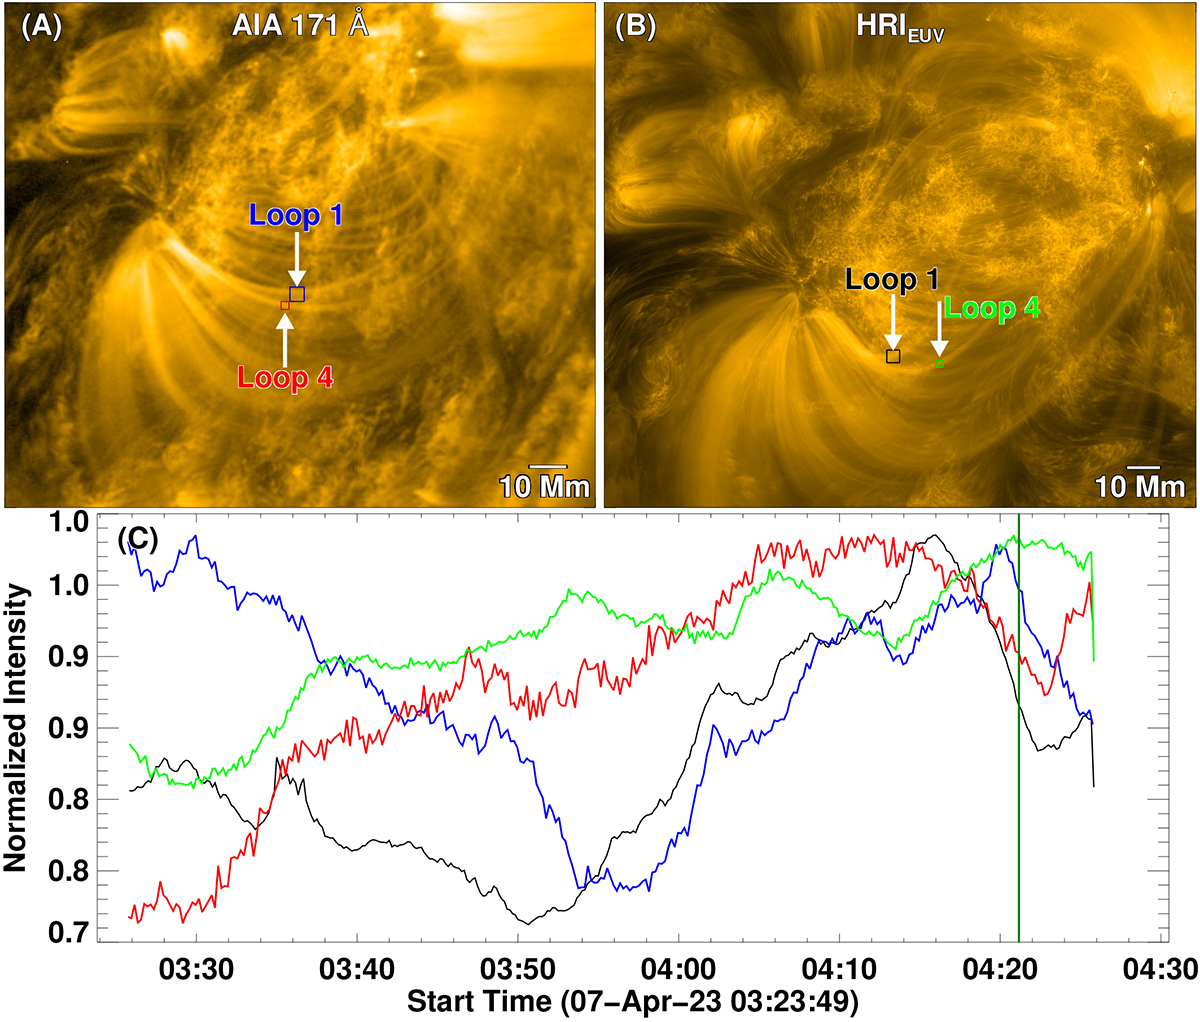
Fig. A.1.
Download original image
Difference in the evolution patterns of adjacent loops. Panels (A) and (B) showcase snapshots of the AIA 171 Å and HRIEUV passbands, respectively, at 04:21:09 UT. Panel (C) shows the color-coded light curves for the boxes marked in panels (A) and (B). Procedure to calculate light curve is described in the caption of Fig. 2. The box size for loop 1 in AIA and HRIEUV are increased to 9 × 9 and 36 × 36 pixel, respectively.
Current usage metrics show cumulative count of Article Views (full-text article views including HTML views, PDF and ePub downloads, according to the available data) and Abstracts Views on Vision4Press platform.
Data correspond to usage on the plateform after 2015. The current usage metrics is available 48-96 hours after online publication and is updated daily on week days.
Initial download of the metrics may take a while.