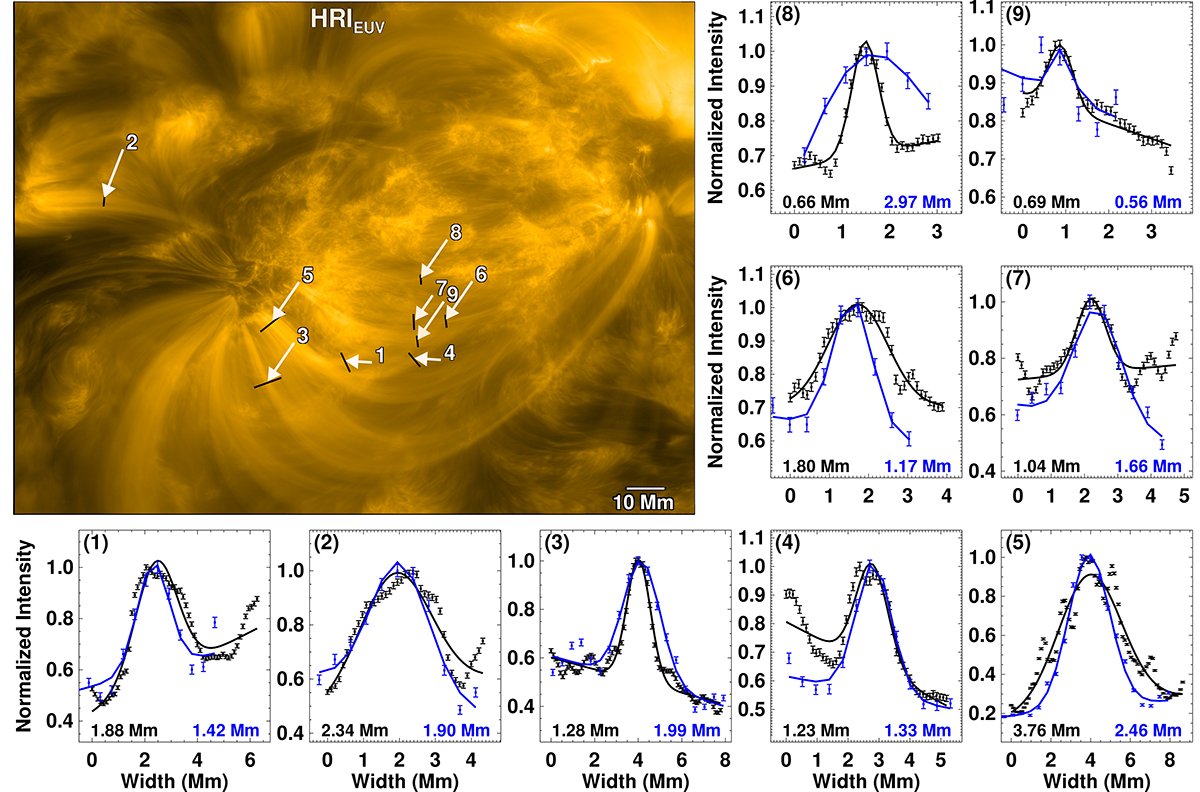
Fig. 4.
Download original image
Comparison of loop widths from two vantage points. For visualization purposes, we selected a single HRIEUV snapshot for each loop at its peak brightness. The top left panel displays the average of these nine snapshots. The black lines indicate slit positions used for width calculations in the HRIEUV data. Panels (1)–(9) plot the intensity profiles for the individual loops (numbered 1–9) corresponding to the positions in the top left panel. Measurements in black (HRIEUV) and blue (AIA 171 Å) represent the loop widths as described in the caption of Fig. 2E. These loop widths are tabulated in Appendix D.1
Current usage metrics show cumulative count of Article Views (full-text article views including HTML views, PDF and ePub downloads, according to the available data) and Abstracts Views on Vision4Press platform.
Data correspond to usage on the plateform after 2015. The current usage metrics is available 48-96 hours after online publication and is updated daily on week days.
Initial download of the metrics may take a while.