Fig. 2.
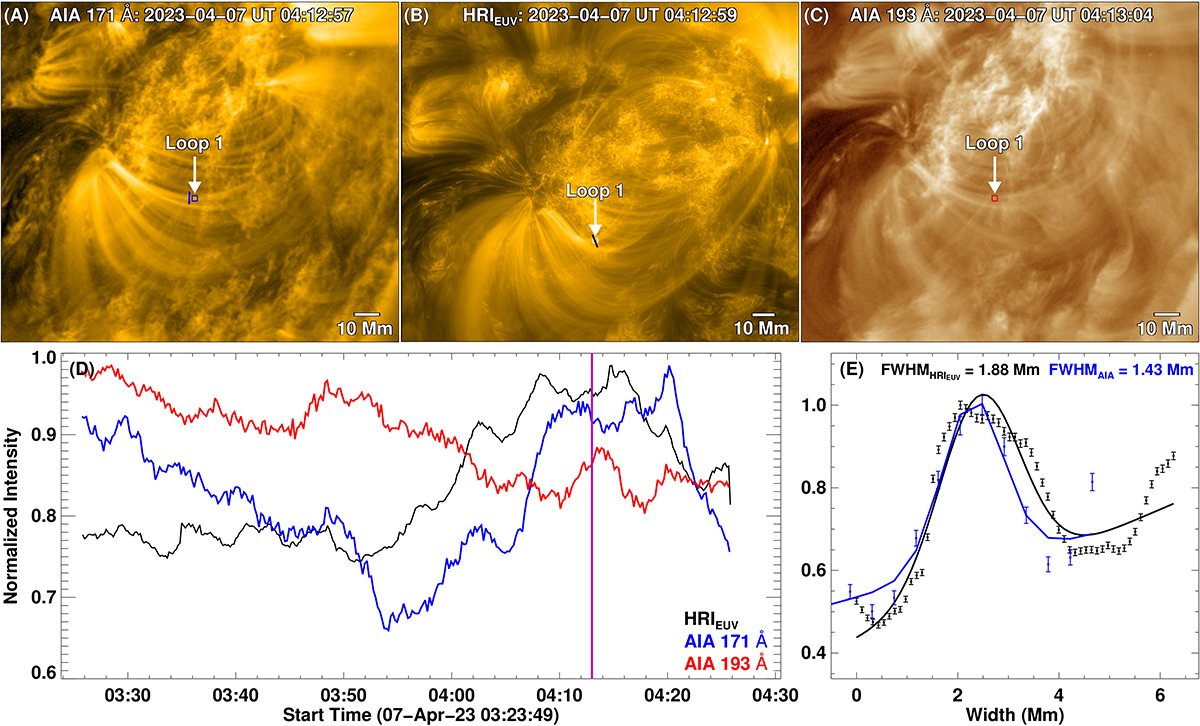
Download original image
Evolution of loop 1. Panels (A)–(C) show the snapshots of loop 1 in the AIA 171 Å, HRIEUV, and AIA 193 Å passbands, respectively. The arrows highlight the color-coded boxes spanning 5 × 5 pixel in both of the AIA passbands and 20 × 20 pixel in the EUI 174 Å passband. The average intensities within these boxes are utilized to compute the light curves, which are subsequently normalized by their individual maximum values. These normalized light curves are plotted in panel (D) using the same colors as their corresponding boxes. The color-coded solid lines near the boxes in panels (A) and (B) represent roughly 1.3 Mm wide artificial slits that we used to calculate the loop widths in panel (E). The lengths of these slits differ for different loops depending upon the loop width and the presence of adjacent loops. The data points in panel (E) correspond to the average intensities observed along the artificial transverse slits, and the solid lines show their respective Gaussian fits. The intensities in panel (E) are normalized with the respective maxima. The error bars show 1σ uncertainties in the measurements due to the Poisson errors that arise from photon noise. Panels (A)–(C) are plotted in log scale. An animation of panels (A)–(D) is available online.
Current usage metrics show cumulative count of Article Views (full-text article views including HTML views, PDF and ePub downloads, according to the available data) and Abstracts Views on Vision4Press platform.
Data correspond to usage on the plateform after 2015. The current usage metrics is available 48-96 hours after online publication and is updated daily on week days.
Initial download of the metrics may take a while.