Fig. 1.
Download original image
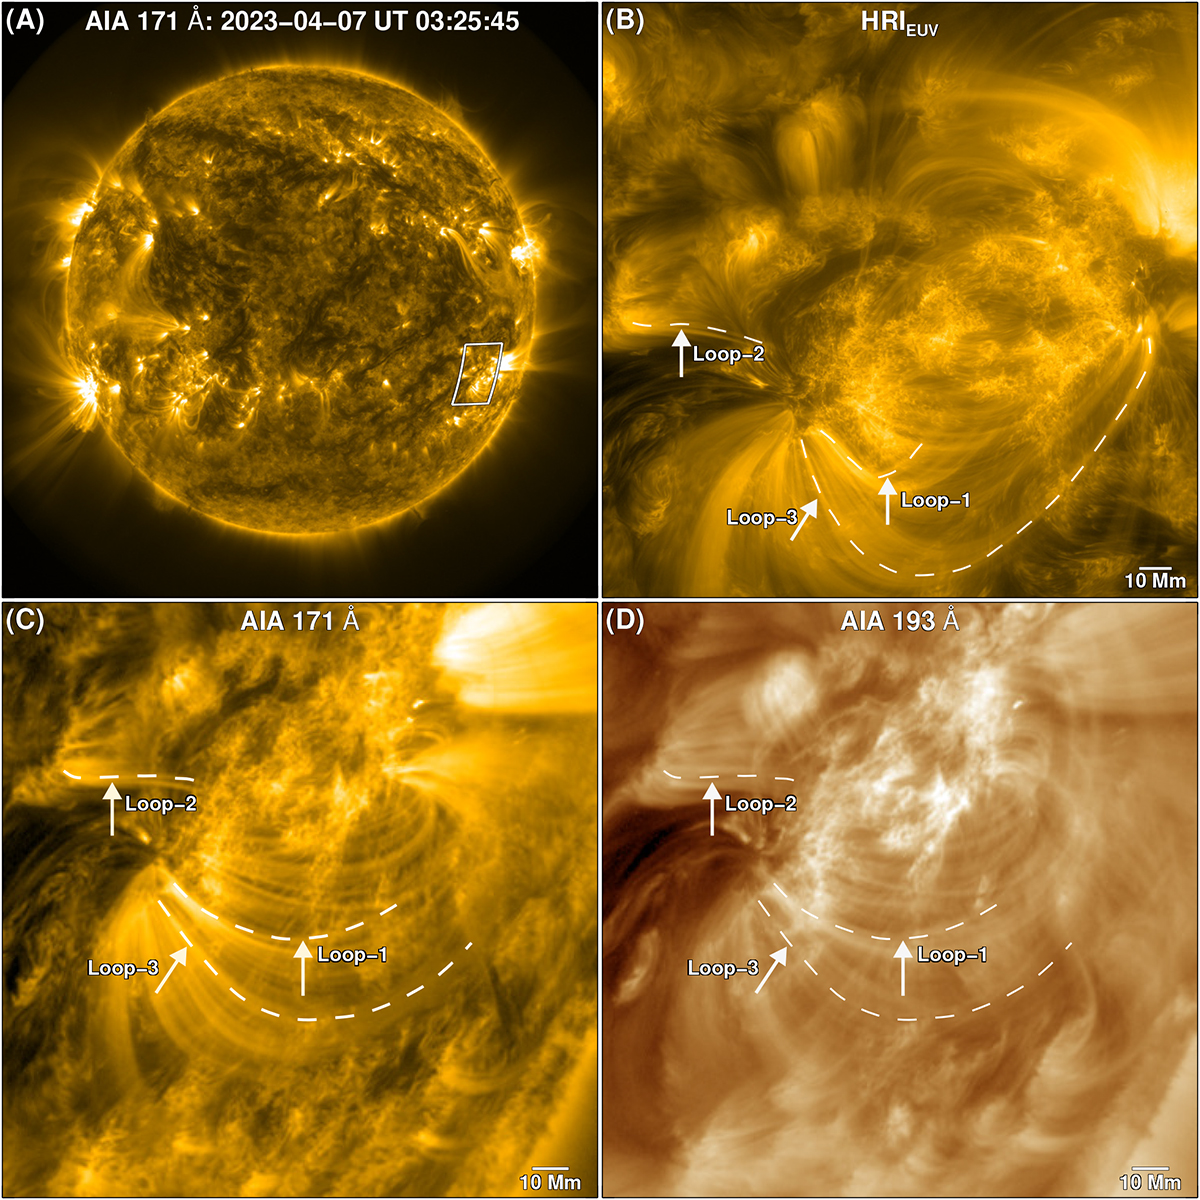
Overview of the observations. Panel (A): Full disk image of the solar corona as observed with 171 Å filter of the SDO/AIA. Panel (B): Part of the field of view of the HRIEUV that shows active region loops. This field of view is outlined by the white box in panel (A). Panels (C) and (D): Roughly the same region as seen by the AIA 171 Å and 193 Å filters, respectively. The white dotted lines trace the three loops described in the text. The intensity in panel (A) is displayed in square root scale. Panels (B)–(D) are time averages of three images for each passband that are closest in time with the image shown in panel (A) and are plotted in log scale.
Current usage metrics show cumulative count of Article Views (full-text article views including HTML views, PDF and ePub downloads, according to the available data) and Abstracts Views on Vision4Press platform.
Data correspond to usage on the plateform after 2015. The current usage metrics is available 48-96 hours after online publication and is updated daily on week days.
Initial download of the metrics may take a while.