Fig. A.3.
Download original image
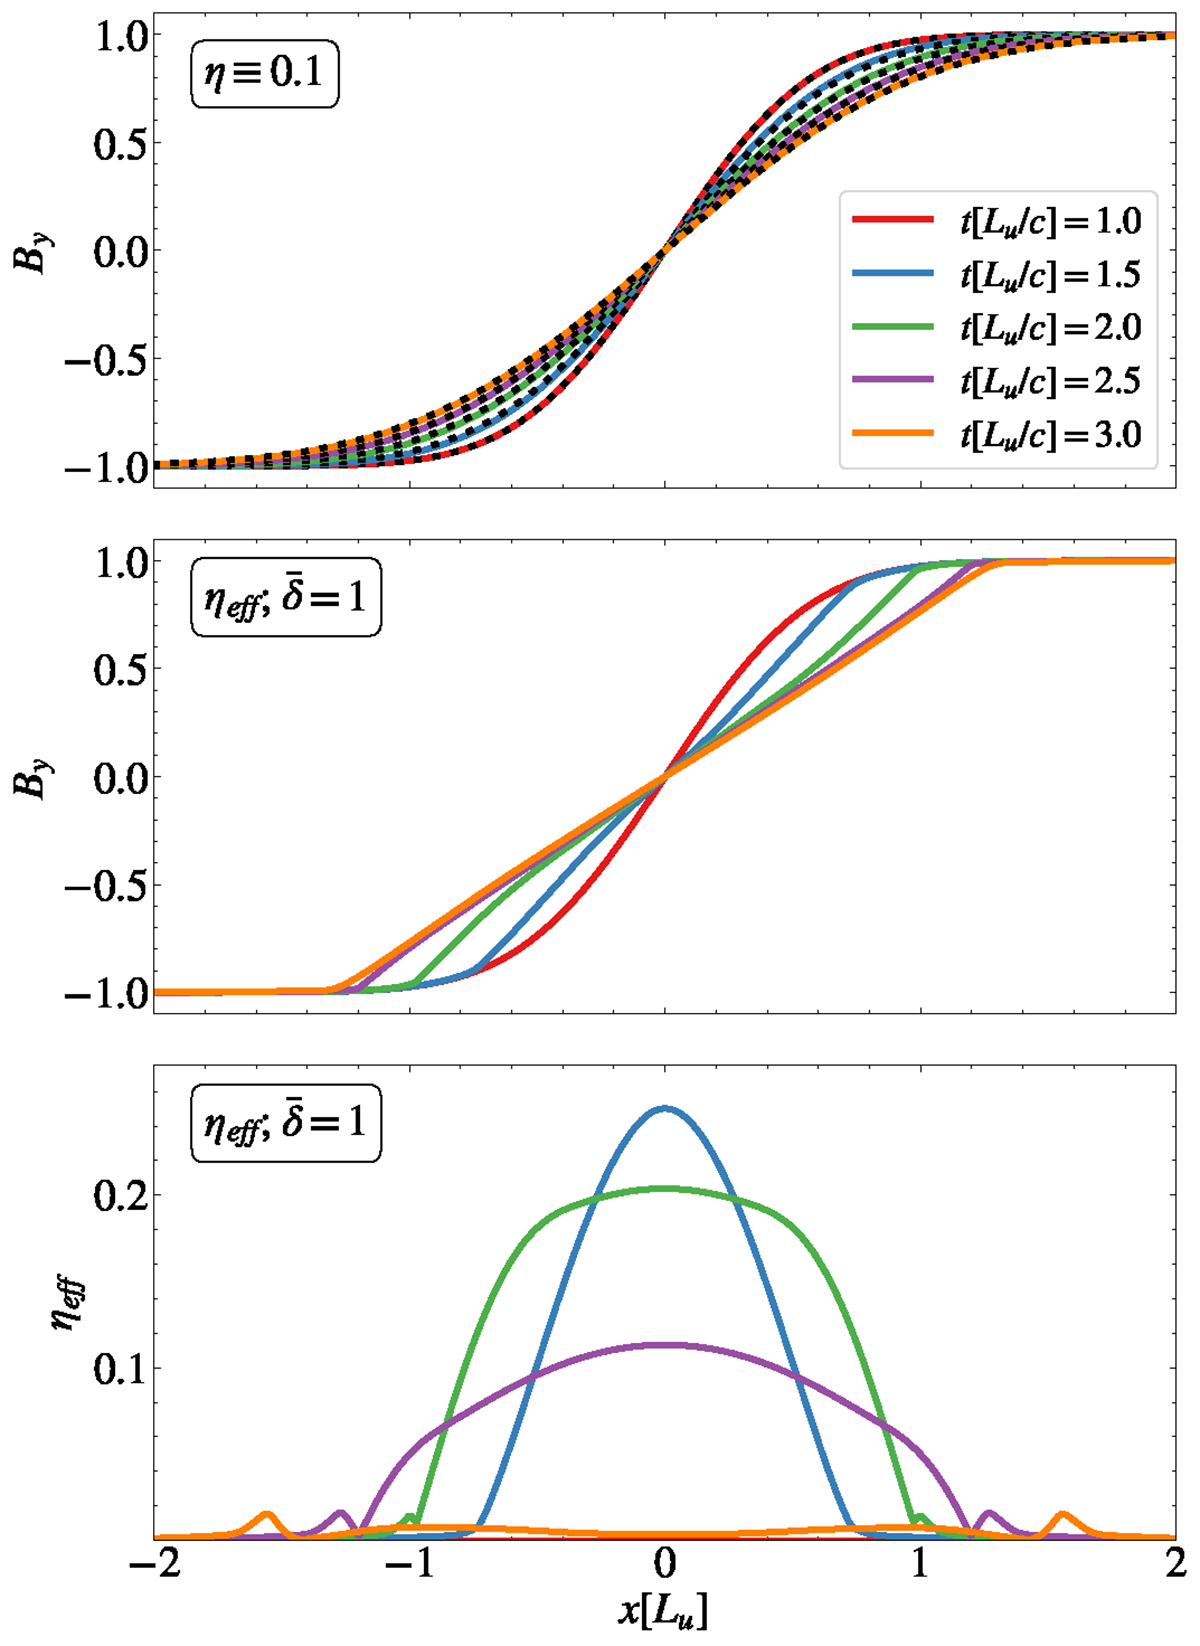
1D self-similar current sheet. Top panel: Spatial profiles of By for a constant resistivity at different times. The analytical solution given by Eq. A.6 is indicated with black dotted lines. Mid panel: Same as the top panel, but using an effective resistivity. Bottom panel: Spatial profiles of effective resistivity at different times.
Current usage metrics show cumulative count of Article Views (full-text article views including HTML views, PDF and ePub downloads, according to the available data) and Abstracts Views on Vision4Press platform.
Data correspond to usage on the plateform after 2015. The current usage metrics is available 48-96 hours after online publication and is updated daily on week days.
Initial download of the metrics may take a while.