Fig. 8
Download original image
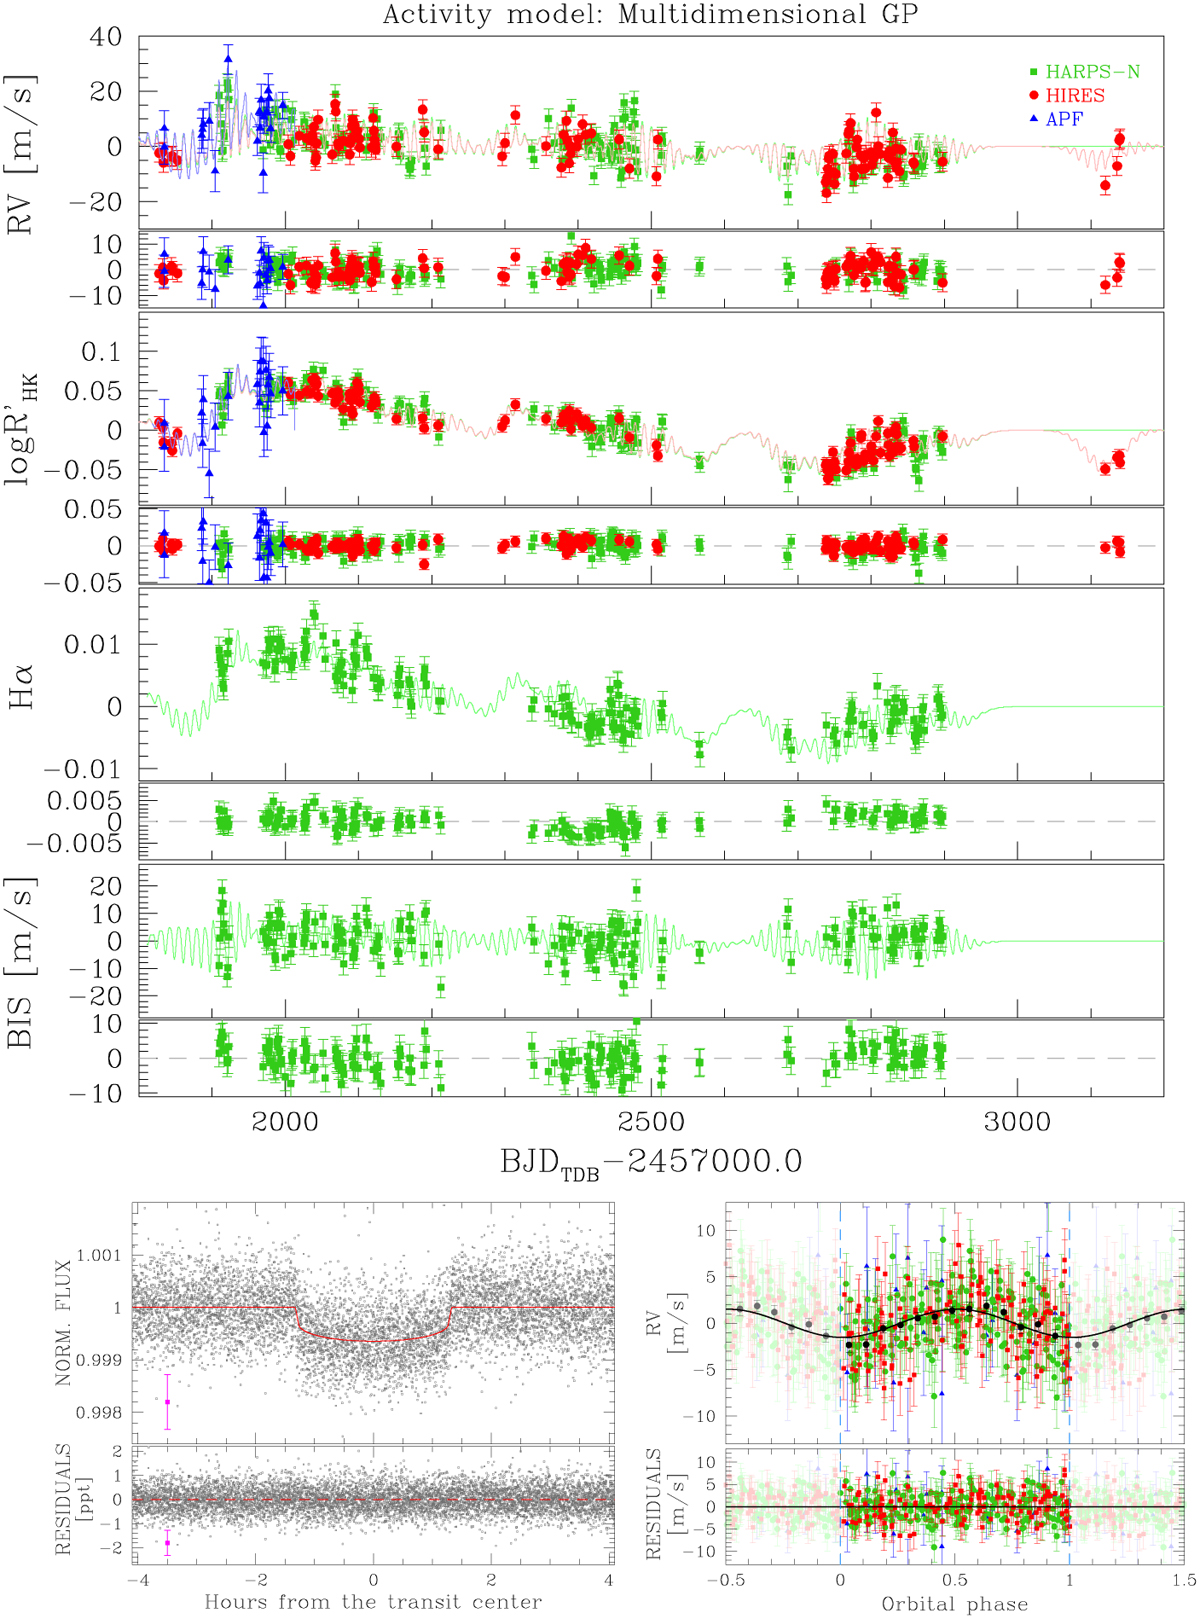
Overview of the modeling that uses the multidimensional GP for the stellar activity. From the top, the first four panels show the RV, log ![]() , Hα, and BIS time series. In green, red, and blue the HARPS-N series, HIRES, and APF time series, respectively. The activity models adopted for each time series are reported with the same colors; below each panel the residuals from the activity model. Panels in the last row: On the left we report the light-curve modeling of TOI-1430 b’s planetary signal; the upper plot shows the folded transits of TOI-1430 b after the detrending of the light curve and, in red, the derived model of the transits. The mean photometric error (considering also the photometric jitter summed in quadrature) is shown in magenta. The lower plot shows the residuals of the light curve after the subtraction of the planetary transit model. The right-hand panels illustrate the planet detection in the RV series; the upper plot is the phase folded RV time series with the period of planet TOI- 1430 b after removing the stellar activity signal with the multidimensional GP. Binned RV points are shown in black, as also the model of planet b. Lower plot shows the RV residuals after removing the planetary model.
, Hα, and BIS time series. In green, red, and blue the HARPS-N series, HIRES, and APF time series, respectively. The activity models adopted for each time series are reported with the same colors; below each panel the residuals from the activity model. Panels in the last row: On the left we report the light-curve modeling of TOI-1430 b’s planetary signal; the upper plot shows the folded transits of TOI-1430 b after the detrending of the light curve and, in red, the derived model of the transits. The mean photometric error (considering also the photometric jitter summed in quadrature) is shown in magenta. The lower plot shows the residuals of the light curve after the subtraction of the planetary transit model. The right-hand panels illustrate the planet detection in the RV series; the upper plot is the phase folded RV time series with the period of planet TOI- 1430 b after removing the stellar activity signal with the multidimensional GP. Binned RV points are shown in black, as also the model of planet b. Lower plot shows the RV residuals after removing the planetary model.
Current usage metrics show cumulative count of Article Views (full-text article views including HTML views, PDF and ePub downloads, according to the available data) and Abstracts Views on Vision4Press platform.
Data correspond to usage on the plateform after 2015. The current usage metrics is available 48-96 hours after online publication and is updated daily on week days.
Initial download of the metrics may take a while.