Fig. 6
Download original image
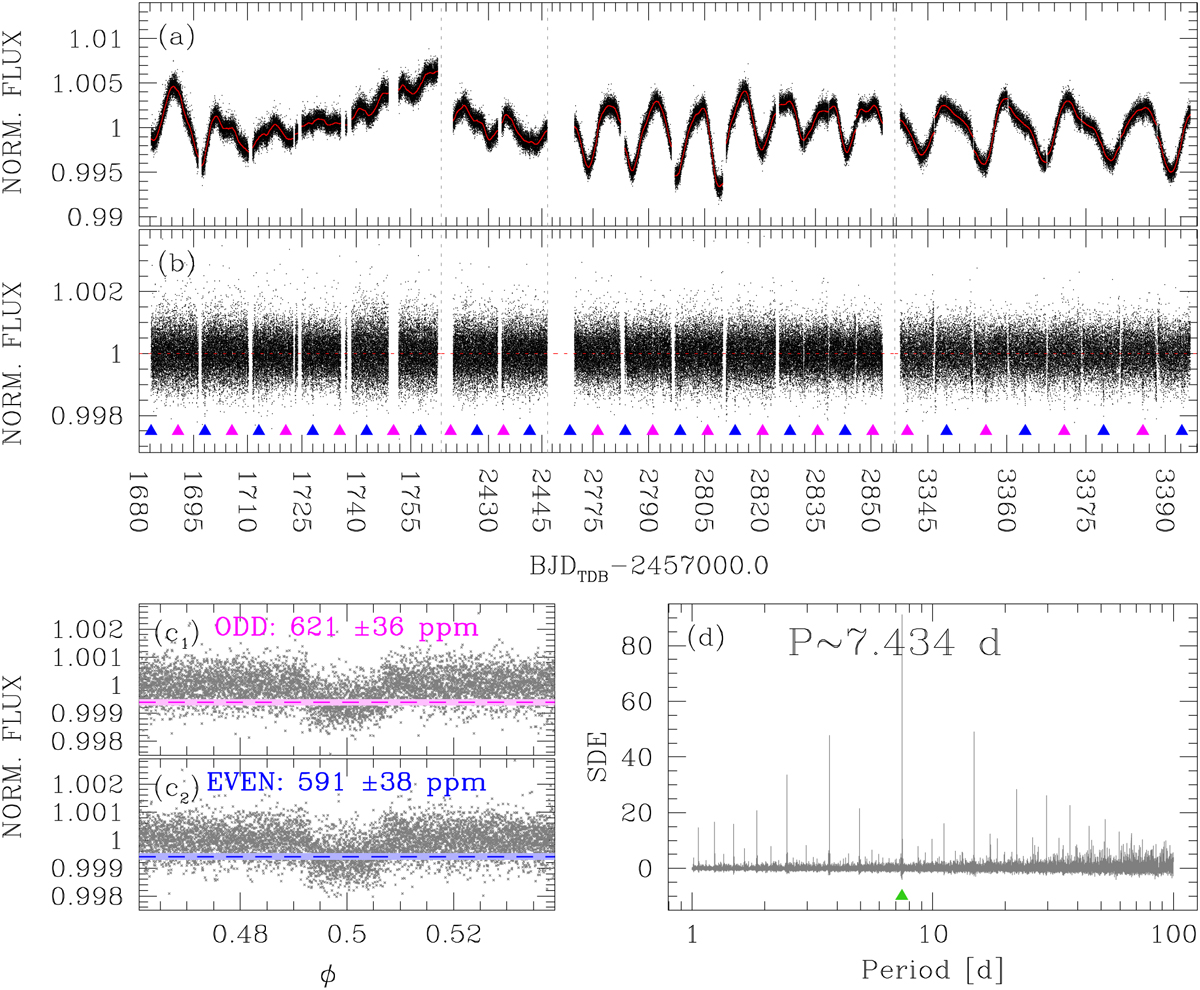
Detection and vetting of the candidate exoplanet TOI-1430.01. Panel a shows the stacked light curve of TOI-1430 and the detrending model (in red). Panel b shows the flattened light curve and the position of the odd (magenta) and even (blue) transits. Panels c are a comparison between the mean depths of the odd and even transits; the dashed lines are the mean depths while the shaded colored regions represent the 3σ confidence interval. Panel d is the TLS periodogram: the period of the peak is indicated with a green triangle.
Current usage metrics show cumulative count of Article Views (full-text article views including HTML views, PDF and ePub downloads, according to the available data) and Abstracts Views on Vision4Press platform.
Data correspond to usage on the plateform after 2015. The current usage metrics is available 48-96 hours after online publication and is updated daily on week days.
Initial download of the metrics may take a while.