Fig. 3
Download original image
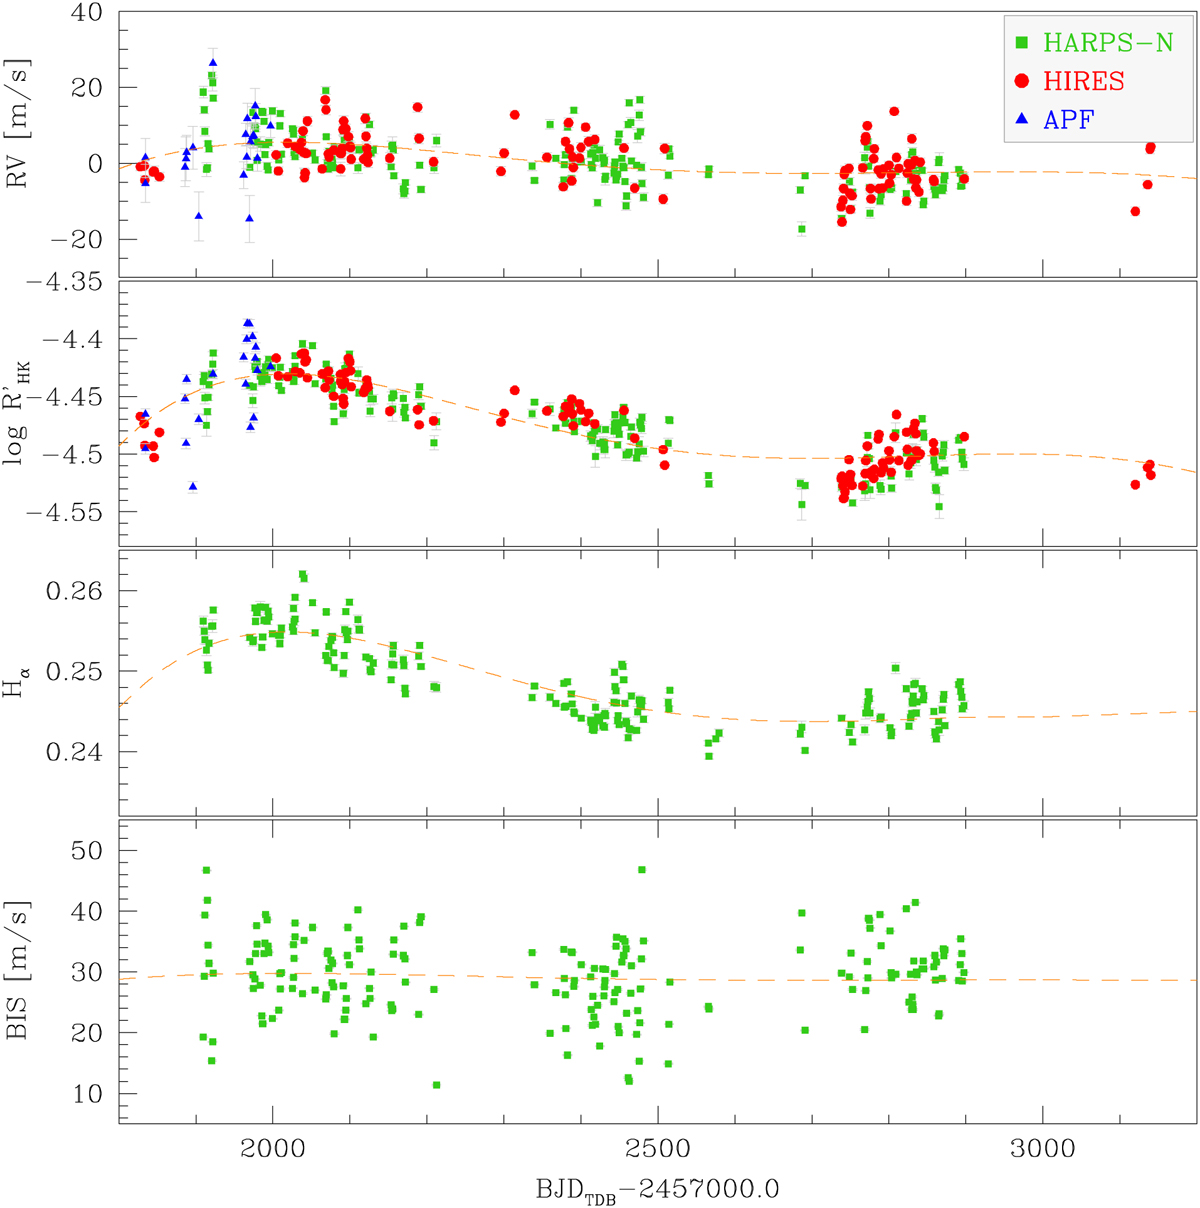
Spectroscopic time series obtained with HARPS-N (green squares), HIRES (red circles), and APF (blue triangles) and used in this work. From the top to bottom panels: The RV, the log R′HK, the Hα, and the BIS time series. Dashed orange lines represent the fifth-degree polynomial models used for the modeling of the long trend in the spectroscopic series. The RVs have been reported in the same scale by applying an offset to them; the log R′HK series are calibrated in the same Mt. Wilson scale (Baliunas et al. 1995).
Current usage metrics show cumulative count of Article Views (full-text article views including HTML views, PDF and ePub downloads, according to the available data) and Abstracts Views on Vision4Press platform.
Data correspond to usage on the plateform after 2015. The current usage metrics is available 48-96 hours after online publication and is updated daily on week days.
Initial download of the metrics may take a while.