Fig. 2
Download original image
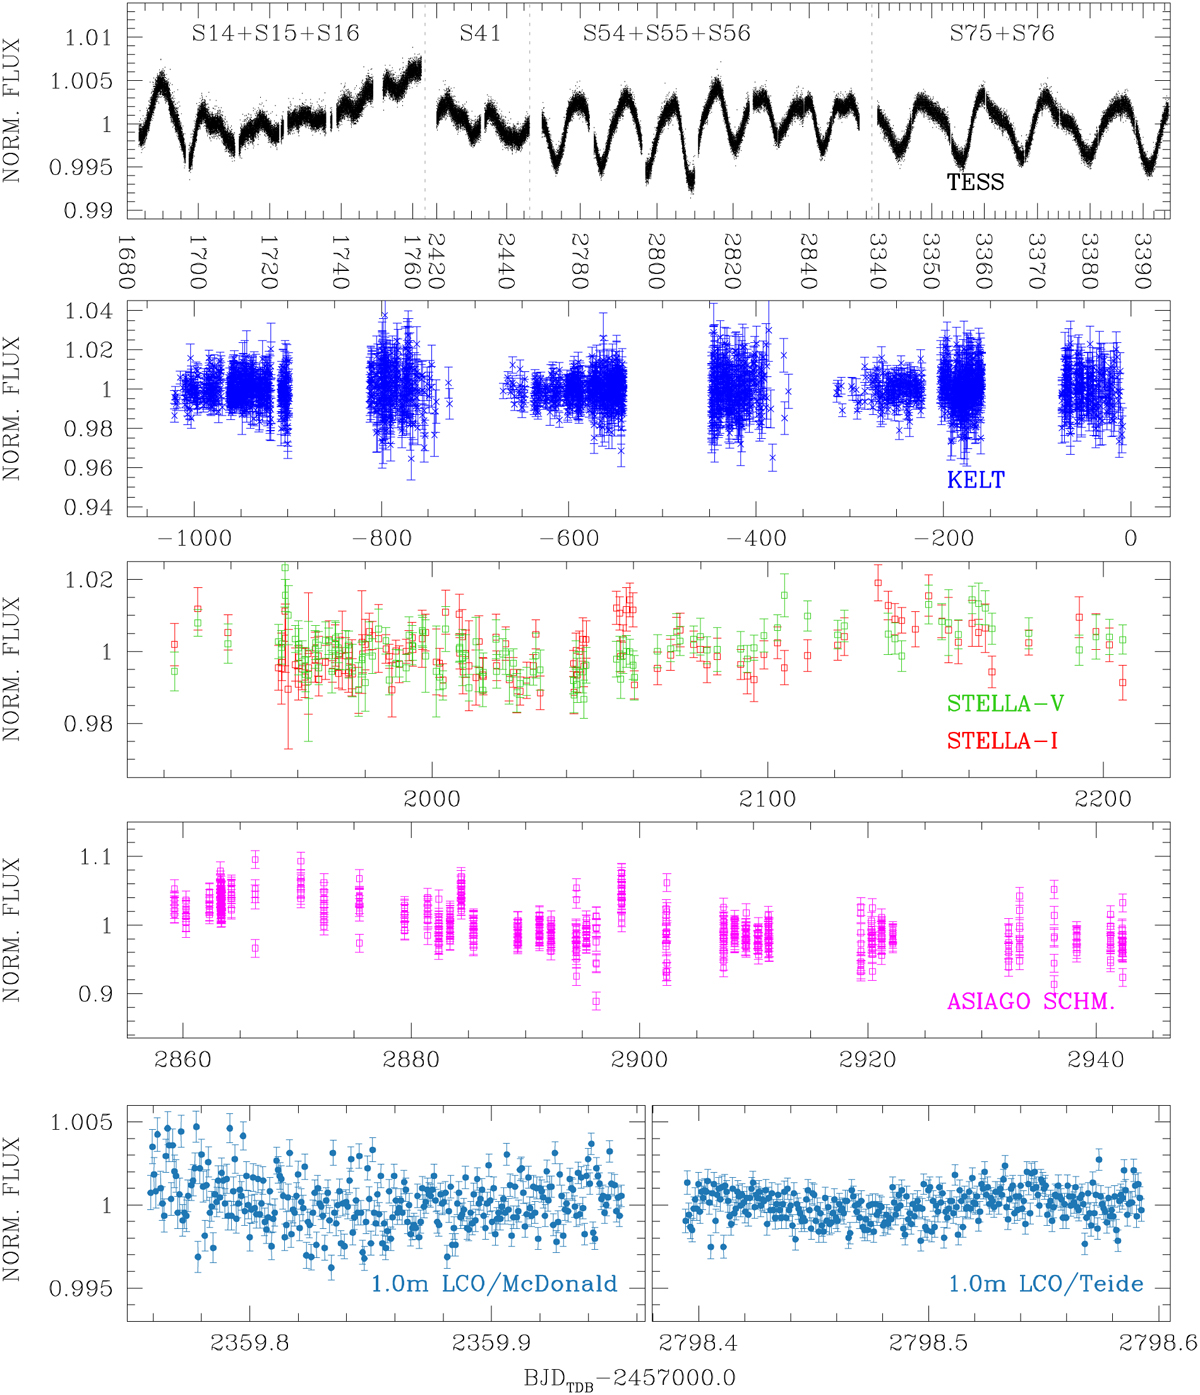
Light curves of TOI-1430 obtained with different instruments. From top to bottom: TESS light curve (black dots) obtained from shortcadence data of sectors 14, 15, 16, 41, 54, 55, 56, 75, and 76, KELT light curve (blue crosses), STELLA light curves (green and red squares for V and I bands, respectively), Asiago Schmidt 67/92 cm u-sloan light curve (magenta squares), and LCO light curves in zs filter (azure circles). Vertical dashed lines in the upper panel indicate the gaps between the different years of the TESS mission.
Current usage metrics show cumulative count of Article Views (full-text article views including HTML views, PDF and ePub downloads, according to the available data) and Abstracts Views on Vision4Press platform.
Data correspond to usage on the plateform after 2015. The current usage metrics is available 48-96 hours after online publication and is updated daily on week days.
Initial download of the metrics may take a while.