Fig. A.1
Download original image
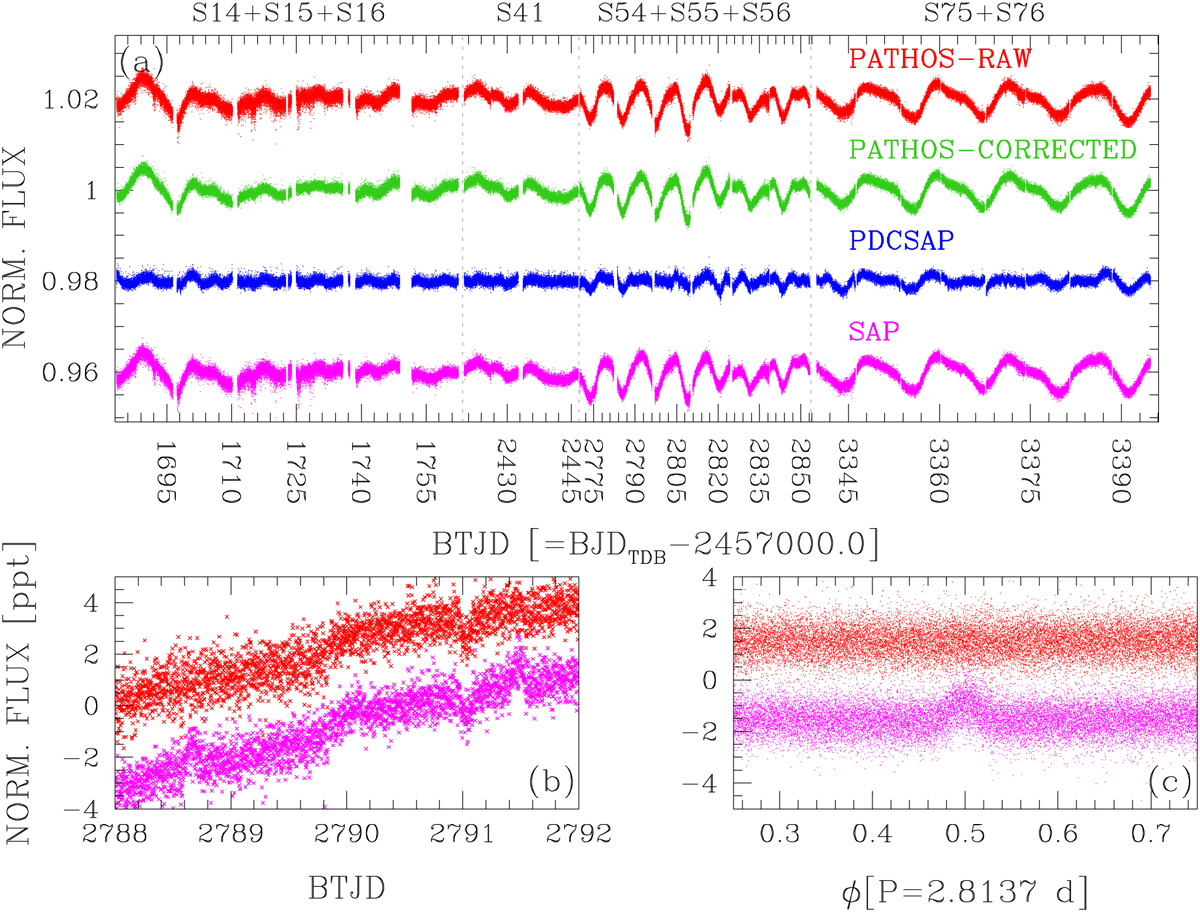
Comparison between the PATHOS and official TESS light curves of TOI-1430. Panel (a) shows the SAP and the PDCSAP light curves (in magenta and blue, respectively) compared to the PATHOS raw and corrected light curves (in red and green, respectively). Gray dashed vertical lines separate the different years in which TOI-1430 was observed by TESSṖanel (b) shows a zoom-in of the raw PATHOS (red) and SAP (magenta) light curves at BTJD= 2790 ± 2 d: spurious signals are detectable at BTJD~eq2788.7 and BTJD~eq2791.5 Panel (c) shows the detrended raw PATHOS and SAP light curves phased with a period P= 2.8137 d, and demonstrates that the systematic signal at 2.8137 d is not present in the PATHOS light curve.
Current usage metrics show cumulative count of Article Views (full-text article views including HTML views, PDF and ePub downloads, according to the available data) and Abstracts Views on Vision4Press platform.
Data correspond to usage on the plateform after 2015. The current usage metrics is available 48-96 hours after online publication and is updated daily on week days.
Initial download of the metrics may take a while.