Fig. 7.
Download original image
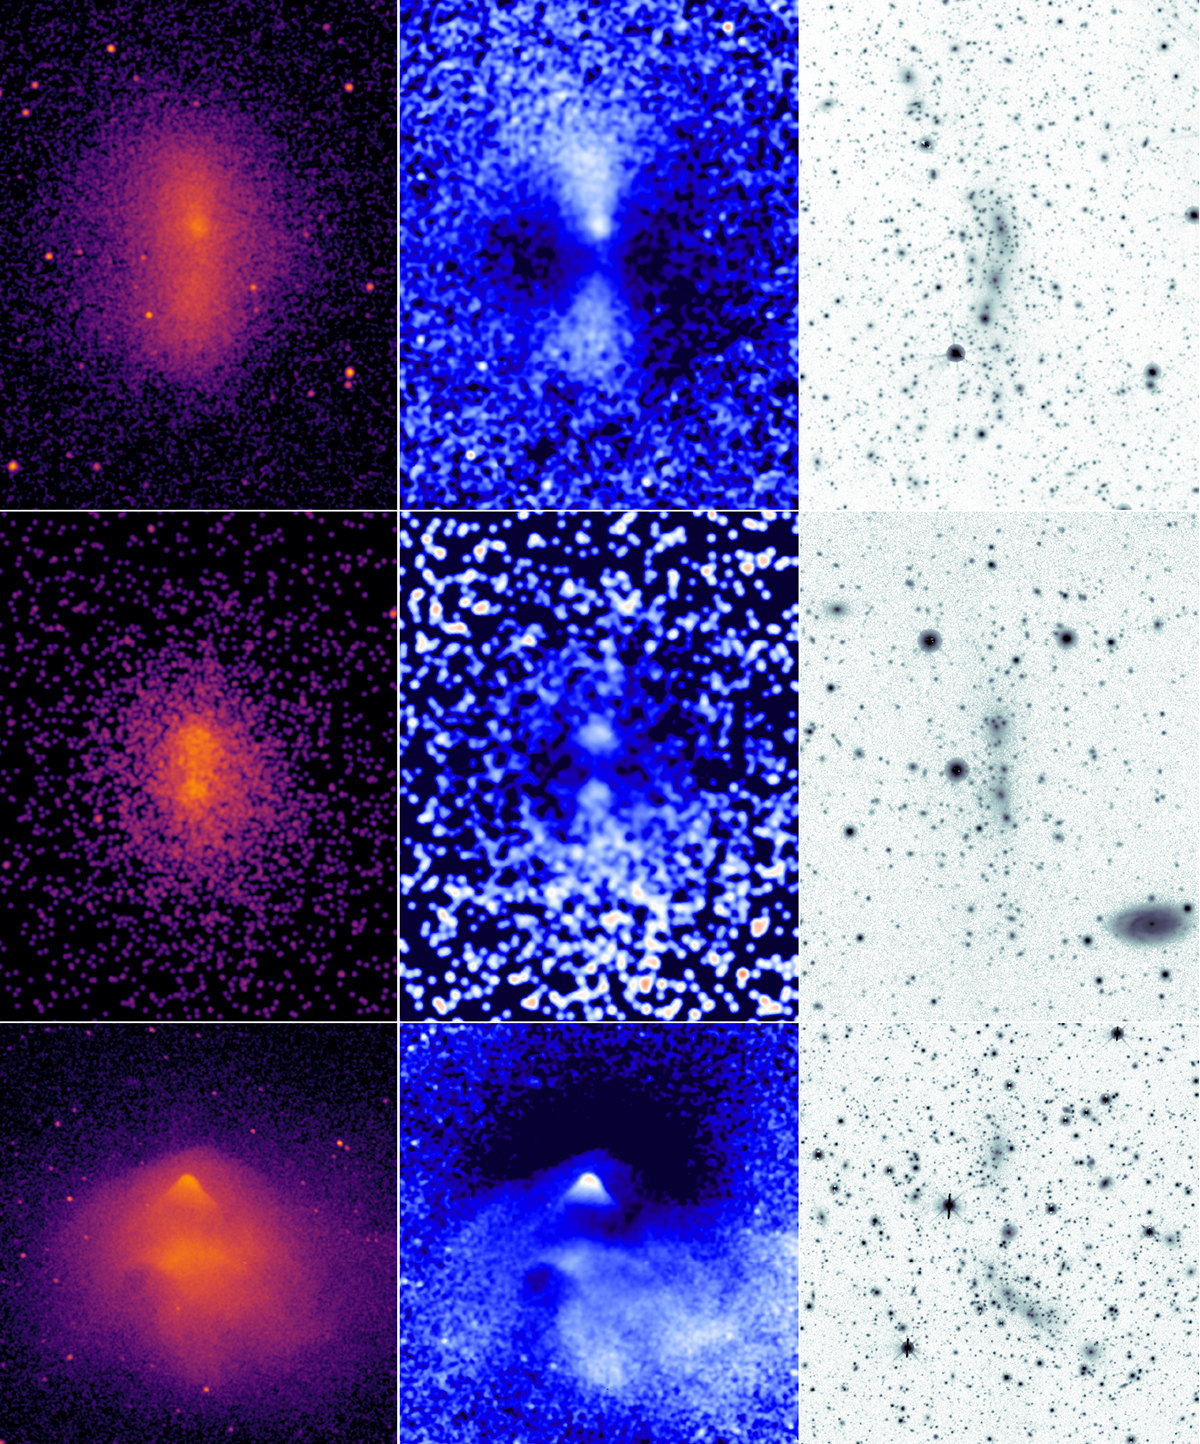
Three stages of the merger illustrated by X-ray and optical images of three massive clusters. From top to bottom: Before the pericenter passage (MACS J0416), shortly after pericenter passage (CL0238), and slightly later (Bullet). The left panels show Chandra X-ray images. The panels in the middle present the residuals after the best-fitting symmetric model of a cluster+background was subtracted from the X-ray image and after dividing by the model (i.e., ![]() ). The right panels show the optical DESI r-band images.
). The right panels show the optical DESI r-band images.
Current usage metrics show cumulative count of Article Views (full-text article views including HTML views, PDF and ePub downloads, according to the available data) and Abstracts Views on Vision4Press platform.
Data correspond to usage on the plateform after 2015. The current usage metrics is available 48-96 hours after online publication and is updated daily on week days.
Initial download of the metrics may take a while.