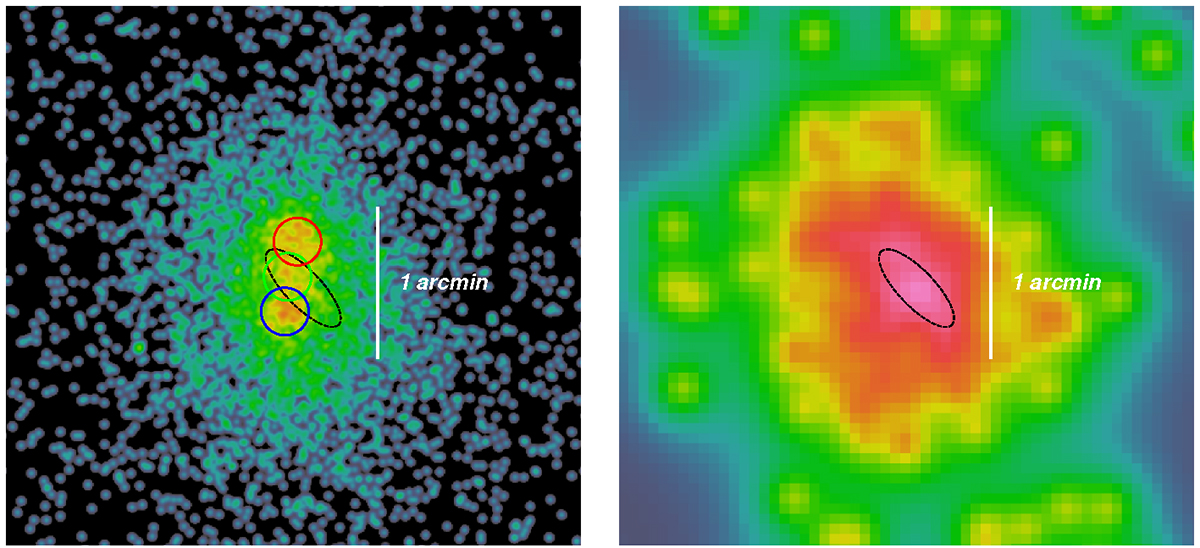
Fig. 5.
Download original image
Zoom into the CL0238 core. Left: Chandra X-ray image with the three circular regions (≈19 arcsec in diameter) that we used to analyze the projected spectra. The best-fitting temperatures are 10.2 ± 2 keV for the bright region to the north (red circle) and 10 ± 1.9 keV for the bright region to the south (blue circle). The temperature measured for the central region (green circle) is slightly lower 7.9 ± 1.4 keV, although the uncertainties of all three measurements are large and the assumption that the temperatures are consistent cannot be rejected. Right: eROSITA image in the [0.3 − 0.7] keV energy range, where the ACIS efficiency drops significantly (see Fig. 6.8 in https://cxc.harvard.edu/proposer/POG/html/chap6.html#tthsEc6.2). The region with the slightly enhanced surface brightness is marked with the dashed ellipse. This ellipse lies just in between the north and south regions with a high X-ray surface brightness in the Chandra image, which corroborates the presence of colder gas in the region. We speculate that this gas might be stripped from the core of the merging subclusters.
Current usage metrics show cumulative count of Article Views (full-text article views including HTML views, PDF and ePub downloads, according to the available data) and Abstracts Views on Vision4Press platform.
Data correspond to usage on the plateform after 2015. The current usage metrics is available 48-96 hours after online publication and is updated daily on week days.
Initial download of the metrics may take a while.