Fig. 4.
Download original image
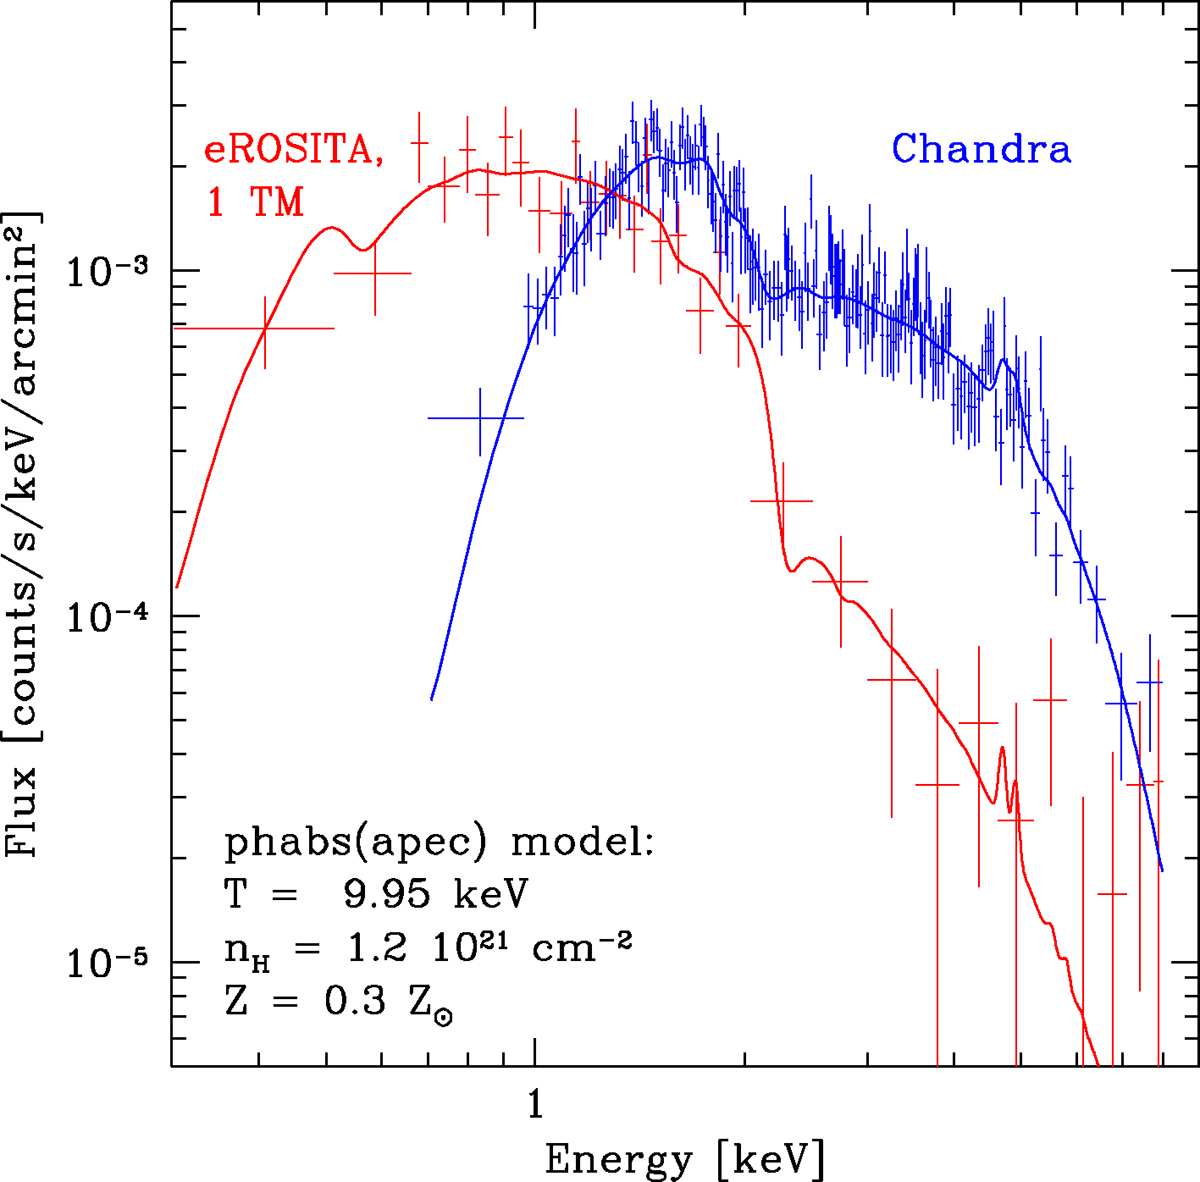
eROSITA and Chandra spectra of CL0238 extracted from a circle with a radius of R500 = 3.9 arcmin. An annulus with R500 < R < 2R500 is used as the background region. Point sources are subtracted. The eROSITA spectrum is normalized per one (out of seven) eROSITA telescope modules. The best-fit absorbed APEC model obtained from the joint analysis of eROSITA+Chandra data is shown with solid curves. The blue and red curves correspond to the same spectral model convolved with the Chandra and eROSITA responses, respectively.
Current usage metrics show cumulative count of Article Views (full-text article views including HTML views, PDF and ePub downloads, according to the available data) and Abstracts Views on Vision4Press platform.
Data correspond to usage on the plateform after 2015. The current usage metrics is available 48-96 hours after online publication and is updated daily on week days.
Initial download of the metrics may take a while.