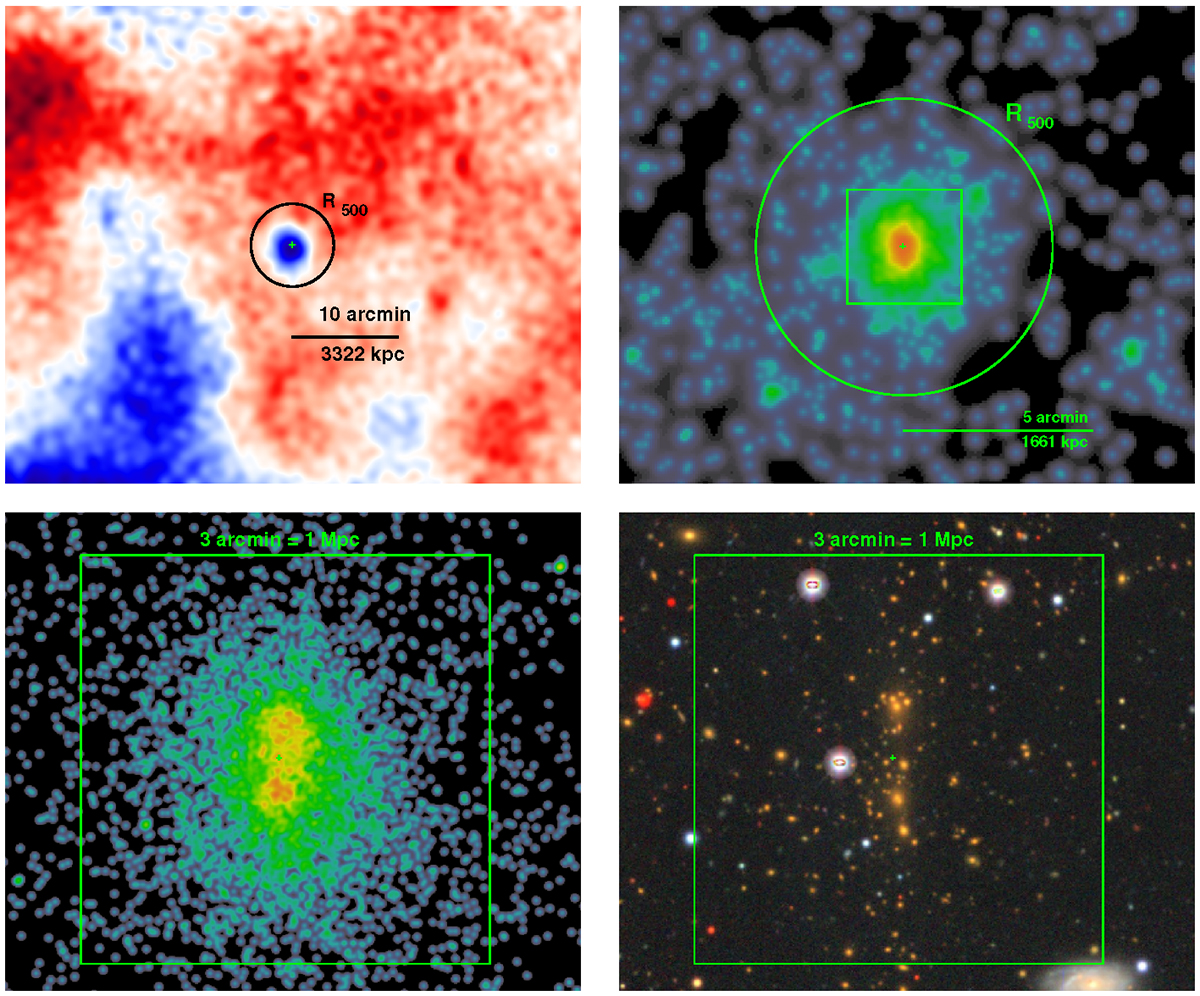
Fig. 2.
Download original image
Multiwavelength view of CL0238. The top row shows the relatively large-scale ACT (90 GHz; smoothed with 30 arcsec) and eROSITA images of the cluster in the 0.3–2.3 keV energy band. The bottom row shows the Chandra image ([0.8–4.0] keV) and the pseudo-color DESI Legacy Imaging Surveys image in the zrg (RGB) filters. The red galaxies at the image center are distributed along the vertical direction, and in all other images, the cluster is clearly elongated in the same direction. The observed elongation is an indication of the perturbed dynamical state of the cluster. The circle has a radius of 3.9 arcmin ≈R500, the green box has a side of 3 arcmin, the central cross marks the cluster center as defined for presentation purposes.
Current usage metrics show cumulative count of Article Views (full-text article views including HTML views, PDF and ePub downloads, according to the available data) and Abstracts Views on Vision4Press platform.
Data correspond to usage on the plateform after 2015. The current usage metrics is available 48-96 hours after online publication and is updated daily on week days.
Initial download of the metrics may take a while.