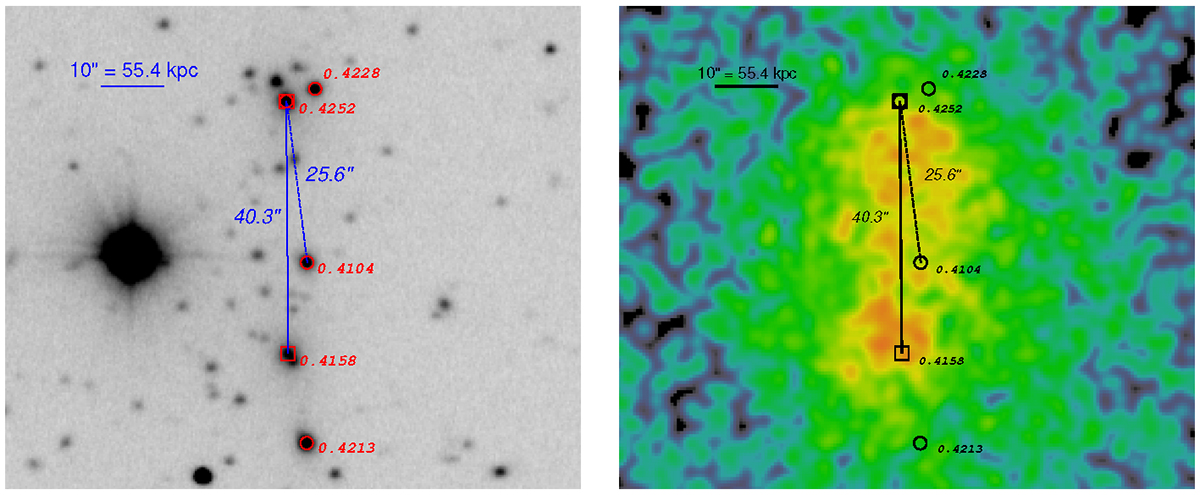
Fig. 1.
Download original image
Spectroscopic redshifts of individual galaxies in SRGe CL0238.3+2005. Galaxies observed with the 6 m BTA telescope are marked as squares, and those observed with the 1.5 Russian-Turkish telescope are marked with circles. Measured redshifts (see Table 1) are presented next to symbols (a square or a circle). The left panel shows the RTT-150 composite rizw image (see Sect. 2), and the right panel shows the Chandra image. One subhalo might be associated with four visually clustered galaxies to the north. For the second subhalo, we considered two options: A galaxy with z = 0.4158 that lies within the southern bright X-ray region (see the right panel), and a galaxy with z = 0.4104 that lies between bright X-ray peaks.
Current usage metrics show cumulative count of Article Views (full-text article views including HTML views, PDF and ePub downloads, according to the available data) and Abstracts Views on Vision4Press platform.
Data correspond to usage on the plateform after 2015. The current usage metrics is available 48-96 hours after online publication and is updated daily on week days.
Initial download of the metrics may take a while.