Fig. 3.
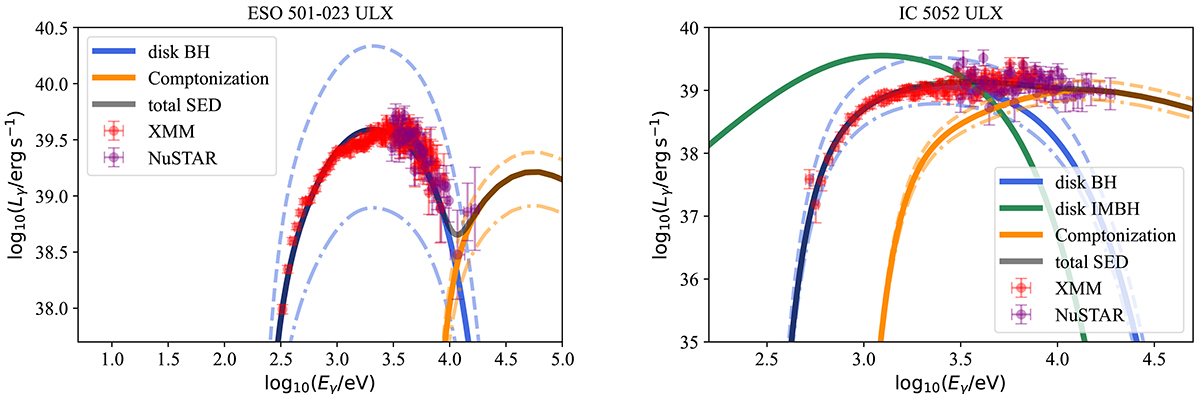
Download original image
Spectral energy distributions (SEDs) of the X-ray emission of ESO501 (left) and IC5052 (right) on a logarithmic scale. In both cases, red data correspond to the PN camera of XMM-Newton and purple data to the FPMA camera of NuSTAR. The solid blue lines correspond to the attenuated thermal emission from the inner accretion disk, and the orange line is the nonthermal Comptonization of the thermal photons by the relativistic electrons in the ULX funnels. The solid black line corresponds to the total emission (sum of thermal and nonthermal contributions) assuming the parameter values listed in Table 2. The disk emission of an IMBH is shown with a green line for IC5052. We also show, for comparison, the application of our model assuming alternative values for the accretion rates: 5ṀEdd (dash-dotted lines) and 15ṀEdd (dashed lines) for ESO501, and 5ṀEdd (dash-dotted lines) and 10ṀEdd (dashed lines) for IC5052.
Current usage metrics show cumulative count of Article Views (full-text article views including HTML views, PDF and ePub downloads, according to the available data) and Abstracts Views on Vision4Press platform.
Data correspond to usage on the plateform after 2015. The current usage metrics is available 48-96 hours after online publication and is updated daily on week days.
Initial download of the metrics may take a while.