Fig. 2.
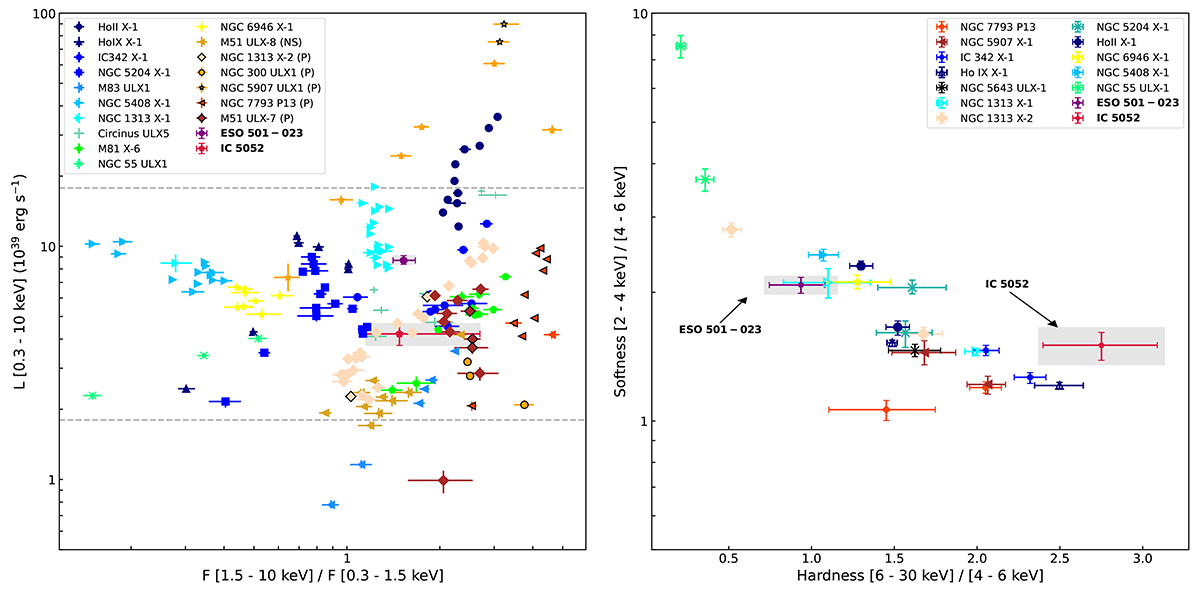
Download original image
HLD and CCD for ULXs taken from Gúrpide et al. (2021a) and Pintore et al. (2017), respectively. Left panel: Several ULX sources with different time periods, including PULXs and non-PULXs. All luminosities and fluxes are shown without absorption effects. The lightly shaded red and purple data points correspond to the sources studied in this work. The dashed black lines represent 10 and 100 times the Eddington limit for an NS with a canonical mass of 1.4 M⊙ (∼2 × 1038 erg s−1). Right panel: CCD generated from flux ratio calculations in the 2–4 keV, 4–6 keV, and 6–30 keV energy ranges using the optimal fits described in Table 1. The lightly shaded silver dots represent the sources analyzed in this study.
Current usage metrics show cumulative count of Article Views (full-text article views including HTML views, PDF and ePub downloads, according to the available data) and Abstracts Views on Vision4Press platform.
Data correspond to usage on the plateform after 2015. The current usage metrics is available 48-96 hours after online publication and is updated daily on week days.
Initial download of the metrics may take a while.