| Issue |
A&A
Volume 693, January 2025
|
|
|---|---|---|
| Article Number | L15 | |
| Number of page(s) | 7 | |
| Section | Letters to the Editor | |
| DOI | https://doi.org/10.1051/0004-6361/202452178 | |
| Published online | 14 January 2025 | |
Letter to the Editor
Supernova remnants on the outskirts of the Large Magellanic Cloud
1
Dr. Karl Remeis Observatory, Erlangen Centre for Astroparticle Physics, Friedrich-Alexander-Universität Erlangen-Nürnberg, Sternwartstr. 7, 96049 Bamberg, Germany
2
School of Science, Western Sydney University, Locked Bag 1797, Penrith, NSW 2751, Australia
3
Australian SKA Regional Centre, Curtin Institute of Radio Astronomy, Curtin University, GPO Box U1987 Perth, WA 6845, Australia
4
The Inter-University Institute for Data Intensive Astronomy (IDIA), Department of Astronomy, University of Cape Town, Private Bag X3, Rondebosch 7701, South Africa
5
CSIRO, Space and Astronomy, PO Box 1130 Bentley, WA 6102, Australia
6
Max-Planck-Institut für extraterrestrische Physik, Gießenbachstraße 1, 85748 Garching, Germany
7
Department of Physics, University of Oxford, Keble Road, Oxford OX1 3RH, UK
8
Centre for Radio Astronomy Techniques and Technologies, Department of Physics and Electronics, Rhodes University, PO Box 94 Makhanda 6140, South Africa
9
South African Radio Astronomy Observatory, 2 Fir Street, Black River Park, Observatory 7295, South Africa
10
Department of Physics, Maynooth University, Maynooth, Co Kildare, Ireland
11
CSIRO, Space and Astronomy, Australia Telescope National Facility, PO Box 76 Epping, NSW 1710, Australia
12
Dominion Radio Astrophysical Observatory, Herzberg Astronomy and Astrophysics Research Centre, National Research Council Canada, PO Box 248 Penticton, BC V2A 6J9, Canada
13
Astronomical Observatory, Volgina 7, 11060 Belgrade, Serbia
14
Observatoire Astronomique de Strasbourg, Université de Strasbourg, CNRS, 11 rue de l’Université, 67000 Strasbourg, France
15
Cerro Tololo Inter-American Observatory, NOIRLab, Cassilla 603, La Serena, Chile
16
Faculty of Engineering, Gifu University, 1-1 Yanagido, Gifu 501-1193, Japan
⋆ Corresponding author; This email address is being protected from spambots. You need JavaScript enabled to view it.
Received:
9
September
2024
Accepted:
17
December
2024
Abstract
When a star dies, it can explode in a supernova, causing a strong shock wave and forming an interstellar object called a supernova remnant (SNR). Observational studies of SNRs allow us to learn about the different types of progenitors, the explosion mechanisms, the physics of interstellar shocks, and the matter cycle in galaxies. We report on the first detection of SNRs located on the outskirts of a galaxy; namely, the Large Magellanic Cloud (LMC), the largest satellite galaxy of our Galaxy. The sources were discovered ∼3° outside the main stellar and gas distribution of the LMC in the recent surveys in radio with the Australian Square Kilometre Array Pathfinder (ASKAP) and in X-rays with the extended Roentgen Survey with an Imaging Telescope Array (eROSITA). We studied them in follow-up observations with the X-ray Multi-Mirror Mission-Newton telescope and MeerKAT and confirmed them to be SNRs. Their progenitors are most likely stars that had left the LMC due to tidal interaction between the Magellanic Clouds and the Milky Way. SNR J0614-7251 is located in an environment with a similar density to those of the other known SNRs in the LMC, and has similar X-ray properties. SNR J0624-6948, on the other hand, is located in a region with a lower density, n0 < 0.01 cm−3. Its radio shell shows a spectral index and polarisation typical of an SNR.
Key words: ISM: supernova remnants / Magellanic Clouds / X-rays: ISM / X-rays: individuals: SNR J0614-7251 / X-rays: individuals: SNR J0624-6948
© The Authors 2025
 Open Access article, published by EDP Sciences, under the terms of the Creative Commons Attribution License (https://creativecommons.org/licenses/by/4.0), which permits unrestricted use, distribution, and reproduction in any medium, provided the original work is properly cited.
This article is published in open access under the Subscribe to Open model. This email address is being protected from spambots. You need JavaScript enabled to view it. to support open access publication.
1. Introduction
Supernovae are stellar explosions, which are caused either by the collapse of the core of a massive star, forming a neutron star or a black hole (core-collapse supernova), or by the thermonuclear disruption of a white dwarf in a binary system, leaving no compact remnant behind (thermonuclear or type Ia supernova). Supernovae are important for the matter cycle in galaxies and the formation of the next generations of stars, as the shock waves create supernova remnants (SNRs), which heat and ionise the circumstellar medium or the interstellar medium (ISM), sweep up and compress matter, and enrich their environment with chemical elements. The evolution of SNRs is best studied in soft X-ray and radio-continuum emission, since the shocked interior mainly consists of very hot plasma (106 − 107 K), while electrons accelerated in the shocks radiate synchrotron emission. However, due to absorption by matter in the Galactic plane, it is difficult to study these extended sources in our own Galaxy.
The Large Magellanic Cloud (LMC) and the Small Magellanic Cloud (SMC) are the largest satellite galaxies of the Milky Way, and among the closest. The Magellanic Clouds (MCs) are also the only satellite galaxies of the Milky Way with current active star formation. The LMC with its small distance (49.6 ± 0.6 kpc, Pietrzyński et al. 2019), its morphology, which is a disc seen nearly face on, and its low foreground absorption offers the ideal laboratory for the study of a large sample of SNRs in great detail. The proximity enables spatially resolved spectroscopic studies of the SNRs, and the accurately known distance allows for analysis of the energetics of each SNR. In addition, the wealth of wide-field multi-wavelength data available now provides information about the environments in which these SNRs evolve (e.g., Maggi et al. 2014, 2016; Kavanagh et al. 2016, 2022; Bozzetto et al. 2017; Yew et al. 2021).
In the Early Science Project of the Evolutionary Map of the Universe (EMU) survey (Norris et al. 2011, 2021a; Pennock et al. 2021) of the Australian Square Kilometre Array Pathfinder (ASKAP) (Hotan et al. 2021), a faint circular radio source J0624–6948 was detected near the LMC (Filipović et al. 2022). Due to its ring-like shape and unknown nature, Filipović et al. (2022) considered SNR J0624-6948 to belong to the new class of extragalactic Odd Radio Circles (ORCs) (Norris et al. 2021b; Koribalski et al. 2021). However, since no central galaxy was found, it was suggested that it is an intergalactic SNR created by the explosion of a star that resided on the outskirts of the MCs or that was ejected from the Milky Way. In X-rays, since its launch in 2019, eROSITA on board the Spektrum-Roentgen-Gamma (SRG) mission (Predehl et al. 2021) has completed four all-sky surveys (eRASS:4), which provide us with homogeneous coverage of the LMC down to a low-luminosity limit of L≈ 8 × 1033 erg s−1 (Zangrandi et al. 2024). In a systematic search for SNRs, we detected another source SNR J0614-7251 as a candidate for an SNR located outside the LMC. SNR J0614-7251 is located at the outer edge of the present ASKAP observations; hence, no radio counterpart could be detected. Both sources are located about 3° from the outer boundaries of the main stellar population and gas distribution in the LMC in the east, as can be seen in a map showing the distribution of neutral hydrogen (Fig. 1, see Sect. 4). In this paper, we present the results of new observations of the two sources in radio and X-rays, which confirm that these sources are SNRs that are located on the outskirts of the LMC.
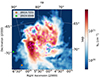 |
Fig. 1. Neutral hydrogen (H I) column density NH map of the LMC obtained with the 64-m Parkes telescope in the HI4PI survey (HI4PI Collaboration 2016) with the positions of known SNRs in the LMC (magenta crosses, Zangrandi et al. 2024) and those of SNR J0614-7251 (orange dot) and SNR J0624-6948 (green dot) (see Sect. 4). |
2. X-ray observations
Following the detections of SNR J0624-6948 with the ASKAP survey and SNR J0614-7251 with eROSITA in eRASS:4, we applied for follow-up observations with the X-ray Multi-Mirror Mission-Newton (XMM-Newton) telescope to have a better understanding of the morphology and possible spectral variations in the source in X-rays. SNR J0624-6948 was observed on March 16 2023 (ObsID 0904600101, PI: P. Maggi) and SNR J0614-7251 on January 15 2024 (ObsID 0921080401, PI: M. Sasaki) with net exposure times of 94 ks and 31 ks, respectively. The data taken with the European Photon Imaging Cameras (EPICs) pn, MOS1, and MOS2 were analysed using the XMM-Newton Science Analysis System (SAS) version 21.0.0.
2.1. Images
To create the images of the X-ray emission, first, events taken with EPIC-pn, MOS1, and MOS2 were binned with a bin size of 50, corresponding to 2.5″, for certain energy bands. After the particle background was subtracted, the resulting images of all three EPICs were exposure-corrected and merged. Figure 2 shows the XMM-Newton images of both sources in the energy bands of 0.3–0.7 keV (soft, in red), 0.7–1.1 keV (medium, in green), and 1.1–5.0 keV (hard, in blue), which are ideal bands in which one can detect and classify SNR emission (Kavanagh et al. 2016). In the soft band, there are emission lines of highly ionised O. In the medium band, there are Fe L-shell lines and Ne lines. The hard band contains emission lines of Mg, Si, and S. If a source shows dominating emission in the medium band in its interiors (thus appearing green in the three-colour image), the ejecta is likely dominated by Fe emission, which is indicative of a type Ia origin (Borkowski et al. 2006), as has already been confirmed for several LMC SNRs (see e.g., Kavanagh et al. 2016, 2022). The XMM-Newton data show that both sources are evolved SNRs with a soft spherical shell. For SNR J0624-6948, we thus detect an X-ray shell for the first time, which is circular and which agrees nicely with the radio morphology. SNR J0614-7251, in addition, shows green interior emission, suggesting that it is a remnant of a type Ia supernova.
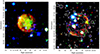 |
Fig. 2. Exposure-corrected three-colour XMM-Newton images of SNR J0614-7251 (left) and SNR J0624-6948 (right) in the energy bands of 0.3–0.7 keV (red), 0.7–1.1 keV (green), and 1.1–5.0 keV (blue). There are point sources visible in and around the SNRs, which are most likely not related to the sources. For SNR J0624-6948, contours of the radio emission (MeerKAT 1284 MHz) are overlaid. |
2.2. Spectra
We extracted spectra from the XMM-Newton data of SNR J0614-7251, while SNR J0624-6948 is too faint for the analysis of the spectrum. For the spectral analysis, we used Xspec version 12.14.0.
We modelled the X-ray spectrum extracted from XMM-Newton EPIC data for the entire SNR J0614-7251, assuming a thermal plasma in non-equilibrium ionisation (NEI, Borkowski et al. 2001, and references therein) with average LMC abundances, absorbed by gas on the line of sight. We considered absorption by foreground material in the Milky Way as well as additional intrinsic absorption. The foreground absorption was fixed to the Galactic column density measured in the HI4PI survey, while the LMC column density was free to vary. As was expected, the fitted X-ray absorption in the LMC is very low with an upper limit of NH < 2.3 × 1020 cm−2. The best-fit temperature for the entire SNR J0614-7251 is kT = (0.27 ± 0.1) keV with an ionisation timescale of  cm−3 s, indicating that the plasma is close to collisional ionisation equilibrium. The errors were calculated using the Markov chain Monte Carlo method implemented in Xspec.
We also extracted the spectrum of only the shell in an annular region and fitted it with an NEI model assuming an average LMC abundance of 0.5 × solar. For the spectrum of the entire SNR, we then included an additional NEI component. The first component was the model for the shell, which was fitted with fixed best-fit values for kT and ionisation timescale τ for the shell, but with free normalisation. The second component for the ejecta emission was fitted with free kT, Fe abundance, τ, and normalisation. These fits indicate that the plasma components are rather in non-equilibrium. The best-fit values are listed in Table A.1.
3. Radio observations of SNR J0624–6948
As SNR J0624-6948 was clearly detected in the radio data, we observed the source using the new high-resolution L-band of MeerKAT and again with ASKAP. In Fig. 3, we show the new radio images.
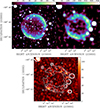 |
Fig. 3. Radio continuum images of SNR J0624-6948 at 1250 MHz (MeerKAT, top left) and at 943 MHz (ASKAP, top right). A polarised intensity image observed with ASKAP is shown at the bottom. The resolution in the images is 8″ × 8″ for MeerKAT and 15″ × 15″ for ASKAP. The white contours in the polarised intensity image indicate the total radio emission in the ASKAP image. All images have a linear colour scale given in μJy beam−1 unit. |
3.1. Images
The MeerKAT observations were conducted on February 10 2022. The observations were taken in the MeerKAT L-Band at a central frequency of 1284 MHz and bandwidth of 800 MHz (856–1712 MHz) under the project code DDT-20211207-MF-01, capture block ID 1644503471. Imaging used a Briggs Robust factor of −1.5 (AIPS/Obit usage), resulting in synthesised beam of 5.92 × 5.84 arcesc2 with a position angle of 89° and the off-source RMS is ∼3.5 μJy beam−1. Two iterations of phase self-calibration were used.
The ASKAP observations were conducted in September 2023 as part of the EMU and POSSUM large-scale surveys (Norris et al. 2011, 2021a) using a complete array of 36 antennas. The data of SNR J0624-6948 were taken at a central frequency of 943.4 MHz with a bandwidth of 288 MHz. The source is located in the tile EMU_0655_69 corresponding to scheduling block SB53304. All data are available through the CASDA1. The ASKAP Stokes I image for EMU and Stokes Q and U data cubes for POSSUM were created using the standard ASKAPsoft pipeline, which includes multi-frequency synthesis imaging, multi-scale cleaning, and self-calibration (Guzman et al. 2019). The final images have a restoring beam of 15 × 15 arcsec2 and an RMS noise of ∼25 μJy beam−1 for Stokes I and ∼15 μJy beam−1 for polarised intensity.
To obtain the polarised intensity image shown in Fig. 3, we used the RM synthesis technique. Instead of the Fourier transform method of the POSSUM pipeline, we used the de-rotation technique described in Ball et al. (2023). A sample FD spectrum, taken from the northwestern part of SNR J0624-6948, is shown in Fig. B.1. A FD spectrum was determined for every pixel in the image. The polarised intensity image represents the peak of the FD function in each pixel.
3.2. Flux densities
We used the MIRIAD (Sault et al. 1995) task IMFIT to extract a total integrated flux density from new MeerKAT and ASKAP images of SNR J0624-6948 as well as flux density measurements reported in Filipović et al. (2022) (see Table A.2). The radio spectrum of an SNR is synchrotron-dominated and is often described as a pure power law of frequency: Sν ∝ να, where Sν is the flux density, ν is the frequency, and α is the spectral index. In Fig. B.2, we present the flux density versus frequency plot for SNR J0624-6948. The relative errors are used for the error bars on a logarithmic plot. The best power-law weighted least-squares fit (thick black line) has a spatially integrated spectral index of ⟨α⟩= − 0.51 ± 0.05, which is consistent with the value reported by Filipović et al. (2022). We also produced a spectral index map for SNR J0624-6948 using MeerKAT 1284 MHz, ASKAP 888 (Filipović et al. 2022) and 943 MHz, and ATCA 2100, 5500, and 9000 MHz (Filipović et al. 2022) images (Fig. B.3). The images were re-gridded to the finest image pixel size (1 × 1 arcsec2) using the MIRIAD task REGRID. These were smoothed to the lowest data resolution (15 × 15 arcsec2) using the MIRIAD task CONVOL. The MIRIAD task MATHS then created the spectral index map.
The flux densities derived from the new radio data, combined with earlier measurements, confirm and better constrain the spectral index of α = −0.51 ± 0.05, which is typical for an SNR. Both in X-ray and in radio band, the SNR has a perfect circular shape. In radio, it shows a typical bilateral symmetry and emits synchrotron emission that is linearly polarised. We detect faint polarised emission at the 5–6σ level in the shell in our ASKAP data (see Fig. 3). The peak percentage of polarisation reaches about 50% in the southeastern shell of the object. The RM values for these polarised emission features are between +20 and +40 rad m−2, which is the same range for compact extragalactic sources such as active galactic nuclei (AGN), confirming the extragalactic origin of the SNR shell.
4. Environment
Between the LMC and the SMC, there is a neutral gas connecting the two galaxies called the Magellanic Bridge (Mathewson & Ford 1984). Additional gas is also extending further away from the MCs, forming the Magellanic Stream and the Leading Arm (Nidever et al. 2008). The MCs and these gas distributions form the Magellanic System, in which warm ionised gas has also been found outside the MCs (Smart et al. 2023, and references therein). The fact that SNRs are found on the outskirts of the LMC suggests that the ionised gas has a high-enough density for a shock to occur and create an SNR. To estimate the density of the environment in which the SNRs are expanding, we used the H I data of the HI4PI survey (HI4PI Collaboration 2016), which provides a data cube of velocity-resolved column density NH at each position. We analysed the velocity cube from the HI4PI survey in the range of 220–300 km s−1 for the LMC (Nidever et al. 2008; Oh et al. 2022) to calculate the H I column density NH shown in Fig. 1 and used for further calculations.
In Figs. B.4 and B.5, we show the velocity distribution of the atomic H taken in a stripe in the sky including SNR J0614-7251 and SNR J0624-6948, respectively, in the Dec (upper panel) and RA (lower panel) direction. There are gas clouds at similar velocities as the LMC at the position of SNR J0614-7251 and SNR J0624-6948 at 260 km s−1 and 280 km s−1. For an optically thin gas, the integrated intensity can be converted into NH by using the following relation:
![Mathematical equation: $$ \begin{aligned} N_{\mathrm{H} } [\mathrm{cm} ^{-2}] = 1.823 \times 10^{18} \int T_{b}(v) \,dv,\end{aligned} $$](/articles/aa/full_html/2025/01/aa52178-24/aa52178-24-eq2.gif) (1)
(1)
with Tb(v) being the brightness temperature at velocity v (HI4PI Collaboration 2016). Assuming the same depth of 2 kpc as was estimated for the Magellanic Stream (Nidever et al. 2008), we derive a density of n= 0.014 cm−3 and 0.009 cm−3 for SNR J0614-7251 and SNR J0624-6948, respectively.
5. Discussion
If we assume that the SNRs are in the adiabatic expansion phase, we can calculate the expected X-ray luminosity of an SNR at a certain age; that is, with a certain size. From the merged particle-background-subtracted and exposure-corrected images taken with EPICS pn, MOS1, and MOS2 of XMM-Newton, we measured a diameter of 193″ for SNR J0614-7251 and 215″ for SNR J0624-6948. We converted these numbers into a physical size for an assumed distance to each of the sources.
For the shell of an adiabatically expanding SNR, the size and the change in size can be described by the Sedov solution (Sedov 1959; Taylor 1950):
 (2)
(2)
 (3)
(3)
where E0 is the explosion energy,  the mean mass of the nuclei for average LMC abundances (0.5 × solar), and n0 the ambient number density. For the following calculation, we assume an explosion energy of E0 = 1051 erg.
The X-ray luminosity of the hot shocked plasma is
 (4)
(4)
where Λ is the cooling function and ne and nH are the number densities of electrons and protons in the plasma (Hamilton et al. 1983), with
 (5)
(5)
For LMC abundances, the relation between the electron and proton density is ne = 1.20 nH. For the cooling function, Λ, we used the relation from Hamilton et al. (1983) for NEI plasma:
 (6)
(6)
 (7)
(7)
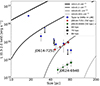 |
Fig. 4. X-ray luminosity, L, over diameter for confirmed mature type Ia SNRs in the LMC, assuming a typical LMC distance of 50 kpc. If the shocked shell can be separated from the ejecta, only the luminosity of the shell is shown. In case the emission of the ejecta could not be separated, the luminosities are shown as upper limits. Theoretical lines for the Sedov model for different ambient densities, n0, are shown as well. We also plot the data for larger distances (60, 70, and 80 kpc). |
In Fig. 4, we show the X-ray luminosity and the extent for confirmed mature type Ia SNRs in the LMC, SNR J0614-7251, and SNR J0624-6948, assuming a typical distance of 50 kpc for the LMC. For SNRs with significant ejecta emission, only the luminosity of the shell component is shown. For SNRs in which the ejecta and the shell cannot be separated, the luminosity is an upper limit for the Sedov solution and is marked as such. We also plot curves for theoretical models for different ambient densities of n0 = 0.001 − 1.0 cm−3. As the luminosities were measured in the energy range of 0.3–2.0 keV, we calculated the fraction of flux for that energy range with respect to the range of 0.1–2.0 keV using the model of Sedov SNRs in Xspec and scaled the theoretical luminosities. For the modelled spectra, we assume a shock temperature of 5 keV and electron temperatures of 0.2–0.6 keV, with an ionisation timescale of τ = net = 1010 cm−3 s and LMC abundances. The average fraction is 0.45.
The comparison with other SNRs and with theoretical models shows that the luminosity and the size of SNR J0614-7251 are consistent with those of the other confirmed SNRs in the LMC. The projected distance from the outer rim of the main disc of the LMC is about 3°, corresponding to 2.6 kpc at a distance of 50 kpc.
For SNR J0624-6948, the comparison to the models suggests that the SNR is expanding in an environment with a lower ambient density. While the source is only detected in the soft X-ray band below ∼1 keV, the foreground column density in its direction is low (NH = 7 × 1020 cm−2), and hence the emission is not absorbed significantly. We conclude that SNR J0624-6948 is located in the outskirts of the LMC, where the remnant is expanding in a lower-density environment. However, as both X-ray emission and radio emission are observed from the outer shell, the ambient density must be significantly higher than in the circum-galactic medium (CGM) of the Milky Way (∼10−5 cm−3 at the location of the LMC, Lucchini et al. 2020).
Surveys of stars (e.g., Skrutskie et al. 2006) have revealed that stars in the LMC are not only distributed in the disc; instead, they seem to form a halo with a scale height of ∼3 kpc (Subramaniam 2006; Mazzi et al. 2021, and references therein). There is also a broad distribution of old stars around the LMC, extending almost to the positions of SNR J0614-7251 and SNR J0624-6948. The star formation history determined by Mazzi et al. (2021) based on the VISTA Magellanic Cloud survey (VMC, Cioni et al. 2011) confirms that the last star formation in these areas occurred > 1 Gyr ago. Therefore, it is highly probable that these two newly detected SNRs are remnants of supernovae of type Ia.
In surveys to detect optical transients, supernovae have been detected outside galaxies (see, e.g., Zinn et al. 2011; Qin et al. 2024). The discovery of SNRs in the outskirts of the LMC confirms that stellar explosions occur outside galaxies and allow us for the first time to study their shocks, stellar ejecta, and environment. It helps to improve our understanding of the evolution of the MCs and the star formation history in and around interacting galaxies. With the new multi-wavelength surveys, we expect to discover more SNRs in the surroundings of the MCs. We already know of another candidate outside the SMC: J0048–7133 (Cotton et al. 2024). This new population of SNRs will allow us to study supernova explosions and SNR evolution in low-density and low-metallicity environments and to better understand the effect of metallicity on star formation and stellar evolution.
Acknowledgments
We thank the anonymous referee for the constructive comments. This research is based on observations obtained with XMM-Newton, an ESA science mission with instruments and contributions directly funded by ESA Member States and NASA. This scientific work uses data obtained from Inyarrimanha Ilgari Bundara / the Murchison Radio-astronomy Observatory. We acknowledge the Wajarri Yamaji People as the Traditional Owners and native title holders of the Observatory site. CSIRO’s ASKAP radio telescope is part of the Australia Telescope National Facility (https://ror.org/05qajvd42). Operation of ASKAP is funded by the Australian Government with support from the National Collaborative Research Infrastructure Strategy. ASKAP uses the resources of the Pawsey Supercomputing Research Centre. Establishment of ASKAP, Inyarrimanha Ilgari Bundara, the CSIRO Murchison Radio-astronomy Observatory and the Pawsey Supercomputing Research Centre are initiatives of the Australian Government, with support from the Government of Western Australia and the Science and Industry Endowment Fund. This paper includes archived data obtained through the CSIRO ASKAP Science Data Archive, CASDA (http://data.csiro.au). The MeerKAT telescope is operated by the South African Radio Astronomy Observatory, which is a facility of the National Research Foundation, an agency of the Department of Science and Innovation. We acknowledge the use of the ilifu cloud computing facility – http://www.ilifu.ac.za, a partnership between the University of Cape Town, the University of the Western Cape, Stellenbosch University, Sol Plaatje University and the Cape Peninsula University of Technology. The ilifu facility is supported by contributions from the Inter-University Institute for Data Intensive Astronomy (IDIA – a partnership between the University of Cape Town, the University of Pretoria and the University of the Western Cape), the Computational Biology division at UCT and the Data Intensive Research Initiative of South Africa (DIRISA). This work made use of the IDIA processMeerKAT pipeline, developed at the Inter-University Institute for Data Intensive Astronomy (IDIA), available at https://idia-pipelines.github.io (DOI: 10.23919/URSIGASS51995.2021.9560276). This work was supported by the Deutsche Forschungsgemeinschaft through the project SA 2131/14-1. M.S. acknowledges support from the Deutsche Forschungsgemeinschaft through the grants SA 2131/13-1 and SA 2131/15-1. M.D.F. and S.L. acknowledge Australian Research Council (ARC) funding through grant DP200100784. P.K. acknowledges support from the Science Foundation Ireland/Irish Research Council Pathway program under grant No. 21/PATH-S/9360. J.D.C. acknowledges financial support from the Inter-University Institute for Data Intensive Astronomy (IDIA). IDIA is a partnership of the University of Cape Town, the University of Pretoria and the University of the Western Cape.
References
- Ball, B. D., Kothes, R., Rosolowsky, E., et al. 2023, MNRAS, 524, 1396 [NASA ADS] [CrossRef] [Google Scholar]
- Borkowski, K. J., Lyerly, W. J., & Reynolds, S. P. 2001, ApJ, 548, 820 [Google Scholar]
- Borkowski, K. J., Hendrick, S. P., & Reynolds, S. P. 2006, ApJ, 652, 1259 [NASA ADS] [CrossRef] [Google Scholar]
- Bozzetto, L. M., Filipović, M. D., Vukotić, B., et al. 2017, ApJS, 230, 2 [NASA ADS] [CrossRef] [Google Scholar]
- Cioni, M. R. L., Clementini, G., Girardi, L., et al. 2011, A&A, 527, A116 [CrossRef] [EDP Sciences] [Google Scholar]
- Cotton, W. D., Filipović, M. D., Camilo, F., et al. 2024, MNRAS, 529, 2443 [NASA ADS] [CrossRef] [Google Scholar]
- Filipović, M. D., Payne, J. L., Alsaberi, R. Z. E., et al. 2022, MNRAS, 512, 265 [CrossRef] [Google Scholar]
- Guzman, J., Whiting, M., Voronkov, M., et al. 2019, Astrophysics Source Code Library [record ascl:1912.003] [Google Scholar]
- Hamilton, A. J. S., Sarazin, C. L., & Chevalier, R. A. 1983, ApJS, 51, 115 [NASA ADS] [CrossRef] [Google Scholar]
- HI4PI Collaboration (Ben Bekhti, N., et al.) 2016, A&A, 594, A116 [NASA ADS] [CrossRef] [EDP Sciences] [Google Scholar]
- Hotan, A. W., Bunton, J. D., Chippendale, A. P., et al. 2021, PASA, 38, e009 [NASA ADS] [CrossRef] [Google Scholar]
- Kavanagh, P. J., Sasaki, M., Bozzetto, L. M., et al. 2016, A&A, 586, A4 [NASA ADS] [CrossRef] [EDP Sciences] [Google Scholar]
- Kavanagh, P. J., Sasaki, M., Filipović, M. D., et al. 2022, MNRAS, 515, 4099 [NASA ADS] [CrossRef] [Google Scholar]
- Koribalski, B. S., Norris, R. P., Andernach, H., et al. 2021, MNRAS, 505, L11 [NASA ADS] [CrossRef] [Google Scholar]
- Lucchini, S., D’Onghia, E., Fox, A. J., et al. 2020, Nature, 585, 203 [CrossRef] [Google Scholar]
- Maggi, P., Haberl, F., Kavanagh, P. J., et al. 2014, A&A, 561, A76 [NASA ADS] [CrossRef] [EDP Sciences] [Google Scholar]
- Maggi, P., Haberl, F., Kavanagh, P. J., et al. 2016, A&A, 585, A162 [NASA ADS] [CrossRef] [EDP Sciences] [Google Scholar]
- Mathewson, D. S., & Ford, V. L. 1984, in Structure and Evolution of the Magellanic Clouds, eds. S. van den Bergh, & K. S. D. de Boer, 1983, 125 [CrossRef] [Google Scholar]
- Mazzi, A., Girardi, L., Zaggia, S., et al. 2021, MNRAS, 508, 245 [NASA ADS] [CrossRef] [Google Scholar]
- Nidever, D. L., Majewski, S. R., & Butler Burton, W. 2008, ApJ, 679, 432 [Google Scholar]
- Norris, R. P., Hopkins, A. M., Afonso, J., et al. 2011, PASA, 28, 215 [Google Scholar]
- Norris, R. P., Marvil, J., Collier, J. D., et al. 2021a, PASA, 38, e046 [NASA ADS] [CrossRef] [Google Scholar]
- Norris, R. P., Intema, H. T., Kapińska, A. D., et al. 2021b, PASA, 38, e003 [NASA ADS] [CrossRef] [Google Scholar]
- Oh, S.-H., Kim, S., For, B.-Q., & Staveley-Smith, L. 2022, ApJ, 928, 177 [NASA ADS] [CrossRef] [Google Scholar]
- Pennock, C. M., van Loon, J. T., Filipović, M. D., et al. 2021, MNRAS, 506, 3540 [NASA ADS] [CrossRef] [Google Scholar]
- Pietrzyński, G., Graczyk, D., Gallenne, A., et al. 2019, Nature, 567, 200 [Google Scholar]
- Predehl, P., Andritschke, R., Arefiev, V., et al. 2021, A&A, 647, A1 [EDP Sciences] [Google Scholar]
- Qin, Y.-J., Zabludoff, A., Arcavi, I., et al. 2024, MNRAS, 530, 4695 [NASA ADS] [CrossRef] [Google Scholar]
- Sault, R. J., Teuben, P. J., & Wright, M. C. H. 1995, ASP Conf. Ser., 77, 433 [NASA ADS] [Google Scholar]
- Sedov, L. I. 1959, Similarity and Dimensional Methods in Mechanics (New York: Academic Press) [Google Scholar]
- Skrutskie, M. F., Cutri, R. M., Stiening, R., et al. 2006, AJ, 131, 1163 [NASA ADS] [CrossRef] [Google Scholar]
- Smart, B. M., Haffner, L. M., Barger, K. A., et al. 2023, ApJ, 948, 118 [NASA ADS] [CrossRef] [Google Scholar]
- Subramaniam, A. 2006, A&A, 449, 101 [NASA ADS] [CrossRef] [EDP Sciences] [Google Scholar]
- Taylor, G. 1950, Proc. R. Soc. London, Ser. A, 201, 159 [CrossRef] [Google Scholar]
- Yew, M., Filipović, M. D., Stupar, M., et al. 2021, MNRAS, 500, 2336 [Google Scholar]
- Zangrandi, F., Jurk, K., Sasaki, M., et al. 2024, A&A, 692, A237 [NASA ADS] [CrossRef] [EDP Sciences] [Google Scholar]
- Zinn, P. C., Grunden, P., & Bomans, D. J. 2011, A&A, 536, A103 [NASA ADS] [CrossRef] [EDP Sciences] [Google Scholar]
Appendix A: Tables
Best-fit values for the spectra of SNR J0614–7251 for the outer shell only and for the entire source using two components.
Flux density measurements for SNR J0624–6948.
Appendix B: Figures
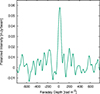 |
Fig. B.1. Faraday depth function of polarised emission from the north-western part of SNR J0624-6948. In this area we find a RM of about +27 rad m−2. |
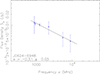 |
Fig. B.2. Spectral index plot of SNR J0624-6948. |
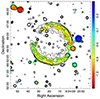 |
Fig. B.3. Spectral index map of SNR J0624-6948 obtained using MeerKAT 1284 MHz, ASKAP 888 and 943 MHz, as well as ATCA 2100, 5500, and 9000 MHz images. The overlaid 1284 MHz contour levels are 15, 25, 35, and 45 μJy beam−1. The colour bar on the right-hand side represents the spectral index. |
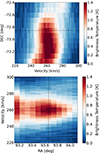 |
Fig. B.4. Parkes H I position-velocity diagrams around the position of SNR J0614-7251, indicated by the dashed line. |
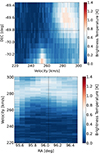 |
Fig. B.5. Parkes H I position-velocity diagrams around the position of SNR J0624-6948, indicated by the dashed line. |
All Tables
Best-fit values for the spectra of SNR J0614–7251 for the outer shell only and for the entire source using two components.
All Figures
|
Fig. 1. Neutral hydrogen (H I) column density NH map of the LMC obtained with the 64-m Parkes telescope in the HI4PI survey (HI4PI Collaboration 2016) with the positions of known SNRs in the LMC (magenta crosses, Zangrandi et al. 2024) and those of SNR J0614-7251 (orange dot) and SNR J0624-6948 (green dot) (see Sect. 4). |
| In the text | |
|
Fig. 2. Exposure-corrected three-colour XMM-Newton images of SNR J0614-7251 (left) and SNR J0624-6948 (right) in the energy bands of 0.3–0.7 keV (red), 0.7–1.1 keV (green), and 1.1–5.0 keV (blue). There are point sources visible in and around the SNRs, which are most likely not related to the sources. For SNR J0624-6948, contours of the radio emission (MeerKAT 1284 MHz) are overlaid. |
| In the text | |
|
Fig. 3. Radio continuum images of SNR J0624-6948 at 1250 MHz (MeerKAT, top left) and at 943 MHz (ASKAP, top right). A polarised intensity image observed with ASKAP is shown at the bottom. The resolution in the images is 8″ × 8″ for MeerKAT and 15″ × 15″ for ASKAP. The white contours in the polarised intensity image indicate the total radio emission in the ASKAP image. All images have a linear colour scale given in μJy beam−1 unit. |
| In the text | |
|
Fig. 4. X-ray luminosity, L, over diameter for confirmed mature type Ia SNRs in the LMC, assuming a typical LMC distance of 50 kpc. If the shocked shell can be separated from the ejecta, only the luminosity of the shell is shown. In case the emission of the ejecta could not be separated, the luminosities are shown as upper limits. Theoretical lines for the Sedov model for different ambient densities, n0, are shown as well. We also plot the data for larger distances (60, 70, and 80 kpc). |
| In the text | |
|
Fig. B.1. Faraday depth function of polarised emission from the north-western part of SNR J0624-6948. In this area we find a RM of about +27 rad m−2. |
| In the text | |
|
Fig. B.2. Spectral index plot of SNR J0624-6948. |
| In the text | |
|
Fig. B.3. Spectral index map of SNR J0624-6948 obtained using MeerKAT 1284 MHz, ASKAP 888 and 943 MHz, as well as ATCA 2100, 5500, and 9000 MHz images. The overlaid 1284 MHz contour levels are 15, 25, 35, and 45 μJy beam−1. The colour bar on the right-hand side represents the spectral index. |
| In the text | |
|
Fig. B.4. Parkes H I position-velocity diagrams around the position of SNR J0614-7251, indicated by the dashed line. |
| In the text | |
|
Fig. B.5. Parkes H I position-velocity diagrams around the position of SNR J0624-6948, indicated by the dashed line. |
| In the text | |
Current usage metrics show cumulative count of Article Views (full-text article views including HTML views, PDF and ePub downloads, according to the available data) and Abstracts Views on Vision4Press platform.
Data correspond to usage on the plateform after 2015. The current usage metrics is available 48-96 hours after online publication and is updated daily on week days.
Initial download of the metrics may take a while.